Regress out covariates such as surrogate variables or principal components.
cleaningY(y, mod, P)Arguments
Value
An object of the same type as y with the SVs/PCs regressed out.
Examples
## Define a model generating function for 30 'samples'
set.seed(20190827)
model_fun <- function(x) {
    ## Baseline + a group effect (2 groups) + a second covariate effect
    rnorm(30) +
        c(rnorm(15, mean = 3), rnorm(15, mean = 1)) +
        c(
            rnorm(5, sd = 0.5), rnorm(5, sd = 0.2, mean = 0.5),
            rnorm(5, sd = 0.2, mean = 0.9)
        )
}

## Generate the data for 20 'genes'
y <- t(sapply(seq_len(20), model_fun))

## Define the phenotype data for these 30 'samples'
pheno <- data.frame(
    group = rep(c("A", "B"), each = 15),
    batch = rep(seq_len(3), each = 5)
)

## Define a full model
mod <- with(pheno, model.matrix(~ group + batch))

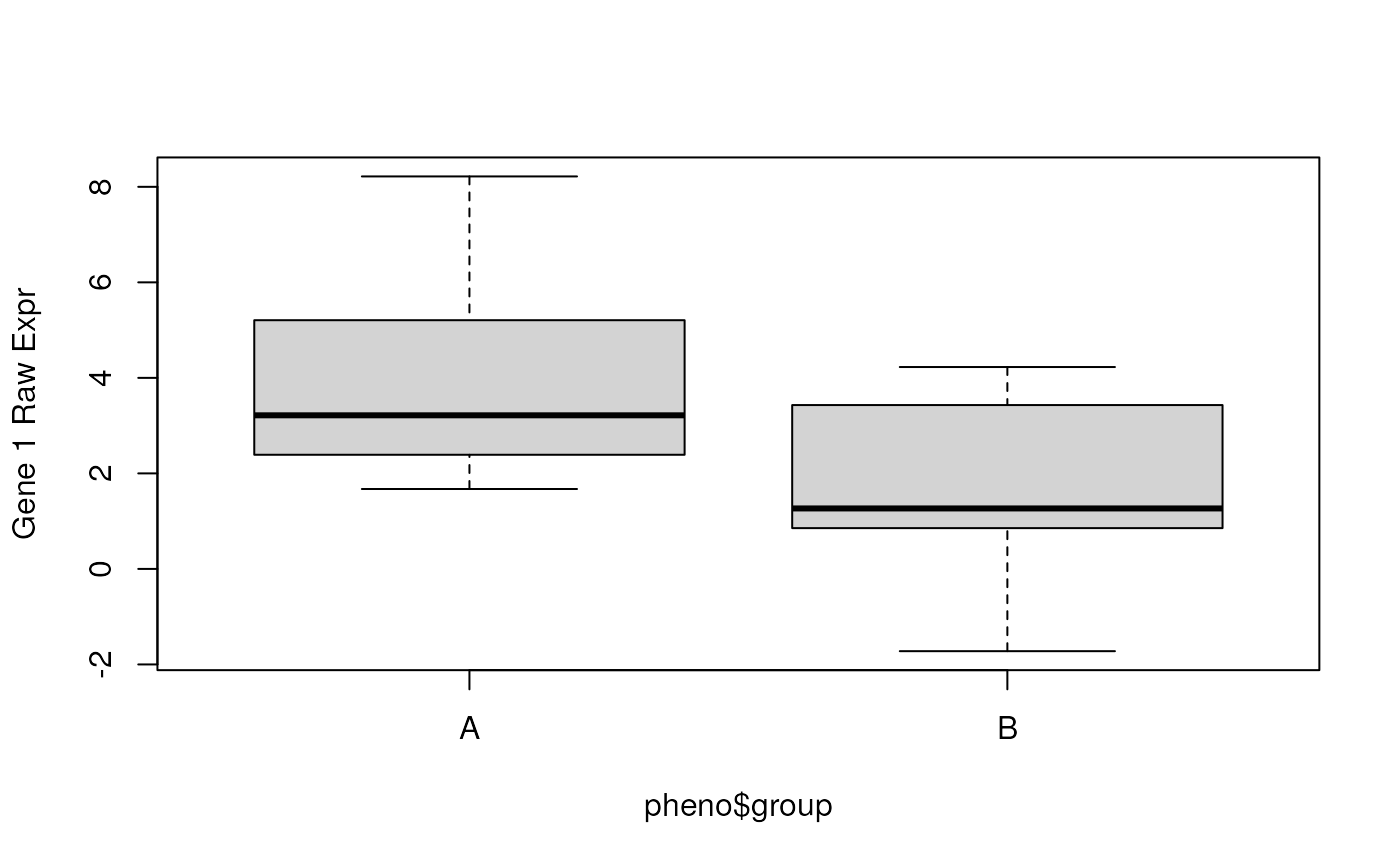
## Check the raw data for gene 1
boxplot(y[1, ] ~ pheno$group, ylab = "Gene 1 Raw Expr")


## Now regress out the batch covariate from the gene expression matrix
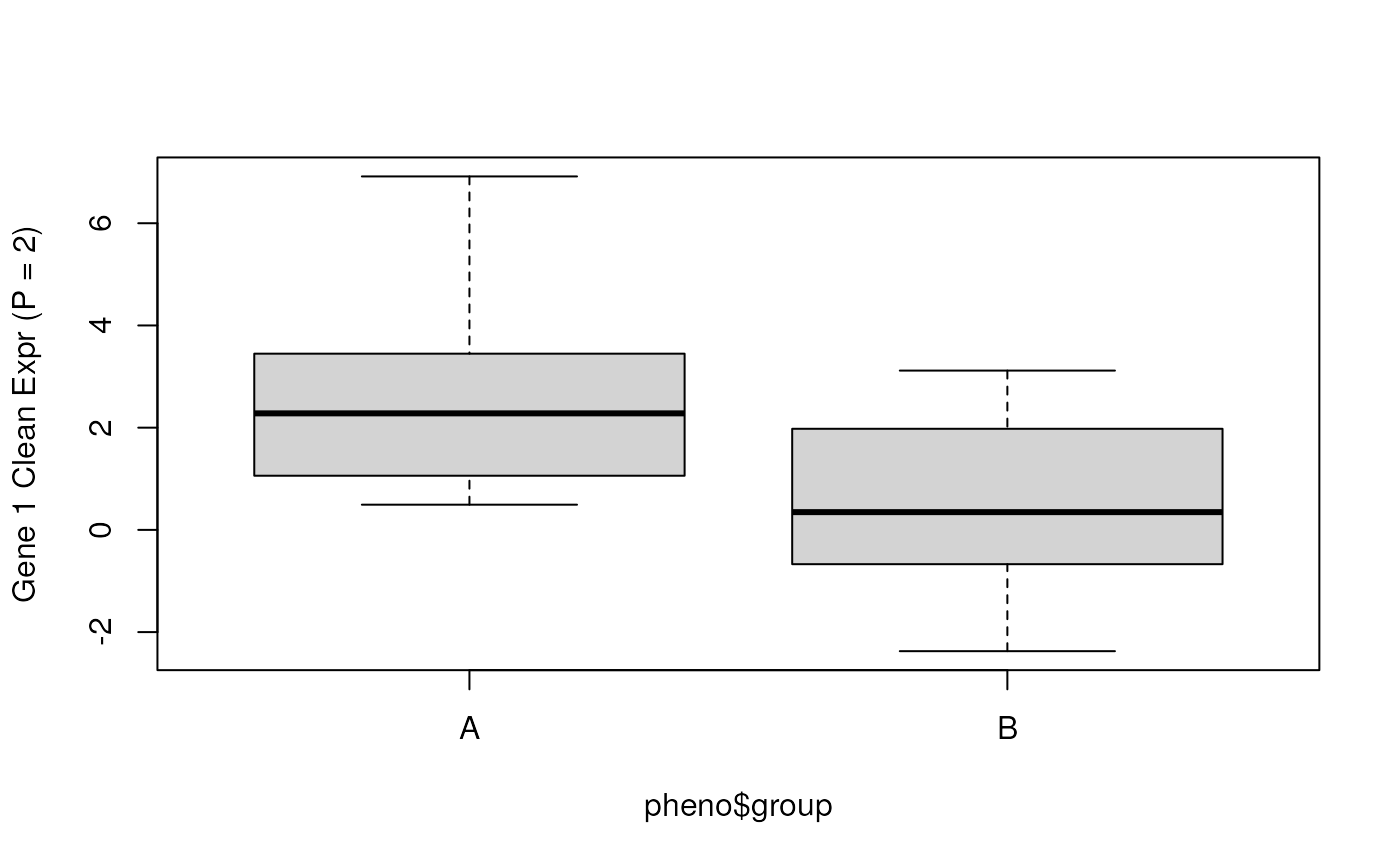
y_clean_p2 <- cleaningY(y, mod, P = 2)

## Check the cleaned data for gene 1 (with P = 2)
boxplot(y_clean_p2[1, ] ~ pheno$group, ylab = "Gene 1 Clean Expr (P = 2)")


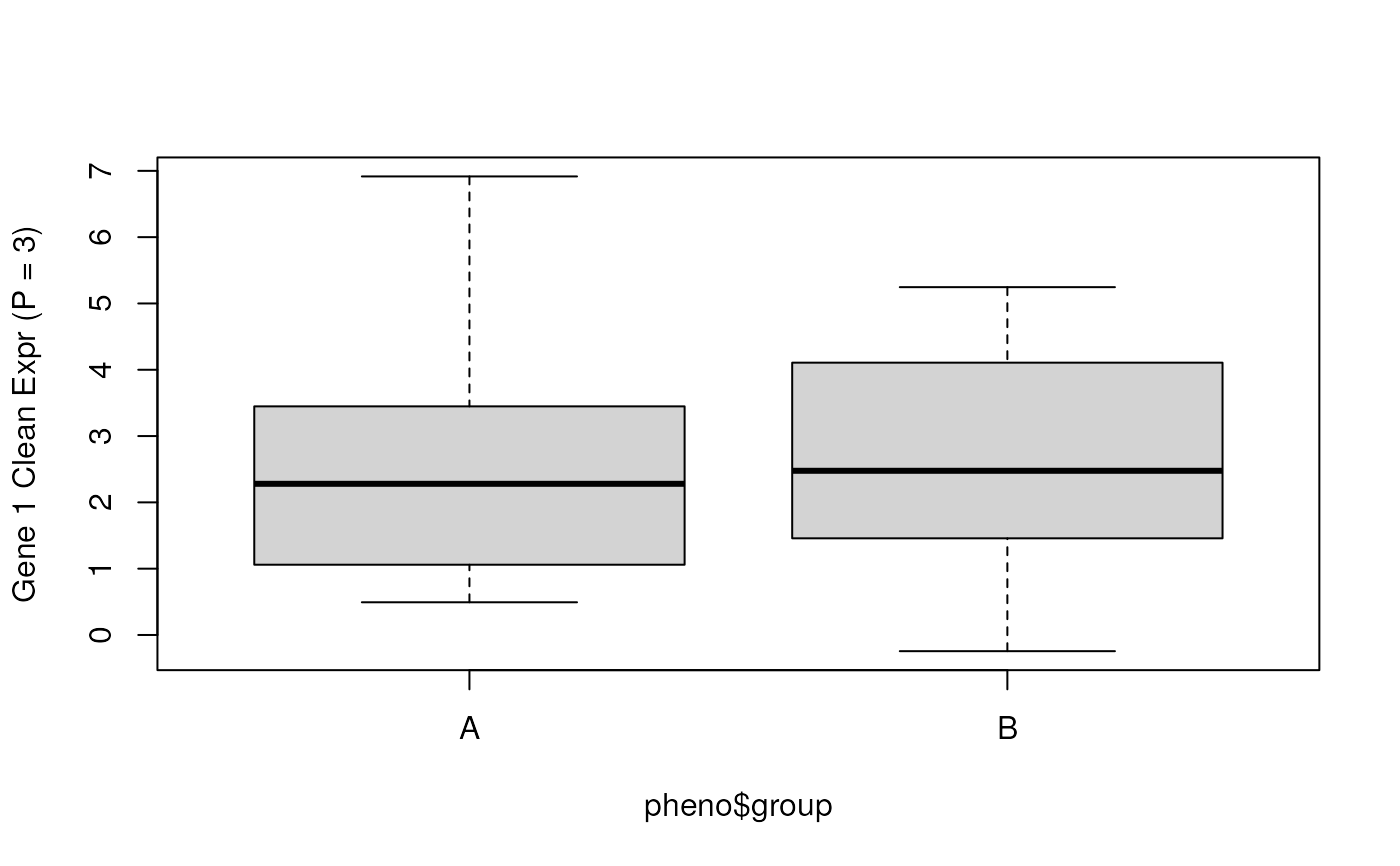
## Or regress out the group and batch effects
y_clean_p3 <- cleaningY(y, mod, P = 1)

## Check the cleaned data for gene 1 (with P = 3)
boxplot(y_clean_p3[1, ] ~ pheno$group, ylab = "Gene 1 Clean Expr (P = 3)")


## The function also supports NAs observations as detailed below

## Make one observation 0, clean the data
y[1, 1] <- 0
y_clean_p2_0 <- cleaningY(y, mod, P = 2)
## then NA and clean again
y[1, 1] <- NA
y_clean_p2_NA <- cleaningY(y, mod, P = 2)

## Compare the results
corner(y_clean_p2_0)
#>                1        2          3         4          5          6
#> [1,] -0.91412161 4.467535  0.8237796 0.7589492 2.30182237  6.3893738
#> [2,]  4.69694020 4.872453  2.7572398 2.6498754 0.81870259  5.6974067
#> [3,]  5.96280181 2.850590  3.0170601 0.4007953 3.90552240  3.1884766
#> [4,]  2.77728433 1.847305 -0.1302775 1.2934618 0.09785331 -0.6839241
#> [5,] -0.01552682 1.422351  0.7492889 3.5181029 3.70823366  0.9740959
#> [6,]  0.92320637 1.789145  1.9848853 3.0993772 2.48755033  1.2495944
corner(y_clean_p2_NA)
#>                1        2          3         4          5          6
#> [1,]          NA 4.467535  0.8237796 0.7589492 2.30182237  6.3893738
#> [2,]  4.69694020 4.872453  2.7572398 2.6498754 0.81870259  5.6974067
#> [3,]  5.96280181 2.850590  3.0170601 0.4007953 3.90552240  3.1884766
#> [4,]  2.77728433 1.847305 -0.1302775 1.2934618 0.09785331 -0.6839241
#> [5,] -0.01552682 1.422351  0.7492889 3.5181029 3.70823366  0.9740959
#> [6,]  0.92320637 1.789145  1.9848853 3.0993772 2.48755033  1.2495944

## They are identical except for that NA in [1, 1]
table(y_clean_p2_0 - y_clean_p2_NA, useNA = "ifany")
#>
#>    0 <NA>
#>  599    1

## Compared to the original y, there are differences since we lost
## one observation which affects all of the first row of the cleaned Y
y_clean_p2[1, ] - y_clean_p2_NA[1, ]
#>         1         2         3         4         5         6         7         8
#>        NA 0.2632404 0.2632404 0.2632404 0.2632404 0.5264807 0.5264807 0.5264807
#>         9        10        11        12        13        14        15        16
#> 0.5264807 0.5264807 0.7897211 0.7897211 0.7897211 0.7897211 0.7897211 0.2632404
#>        17        18        19        20        21        22        23        24
#> 0.2632404 0.2632404 0.2632404 0.2632404 0.5264807 0.5264807 0.5264807 0.5264807
#>        25        26        27        28        29        30
#> 0.5264807 0.7897211 0.7897211 0.7897211 0.7897211 0.7897211
all(y_clean_p2[-1, ] - y_clean_p2_NA[-1, ] == 0)
#> [1] TRUE