VistoSeg: Visium Histology Image Segmentation and Processing Pipeline
Lieber Institute for Brain Development, Johns Hopkins Medical Campusmadhavi.tippani@libd.org
Overview
Histological imaging is a critical first step of the spatial transcriptomics workflow, a barcoding-based transcriptome-wide technology released by 10x Genomics.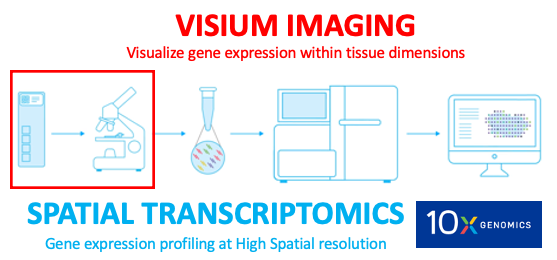
Why spatial transcriptomics or Visium imaging?
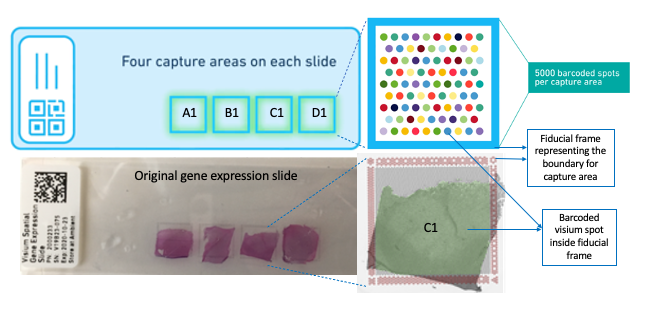
Methods like single-nucleus and single cell RNA-sequencing (RNA-seq) can profile single cells transcriptome-wide enabling researchers to identify cell type compositions; however, these methods necessarily destroy information about spatial positioning. On the other hand, multiplexing and in situ sequencing methods can provide spatial information, but have significant limitations on the number of genes that can be processed as well as issues with microscopy and related computational challenges. Spatial transcriptomics, including the 10X Genomics Visium platform, provides solutions to these limitations by allowing researchers to quantify gene expression with high spatial resolution. A critical component for the 10X Genomics platform to provide spatial context is the Visium imaging of the Visium gene expression slide. On this slide, the experimental tissue sections that are being analyzed are mounted onto the capture areas (A1,B1,C1,D1) located on the slide. The whole slide is then imaged, producing a large output image file that contains all of the capture areas. This image of the whole slide then has to be subsequently split into individual capture area images (necessarily JPEG or tif), which are then processed accordingly for the downstream gene expression analyses.
This website describes the steps required to split, visualize and process the Visium images from spatial transcriptomics projects generated by the 10x Genomics Visium commercial platform.
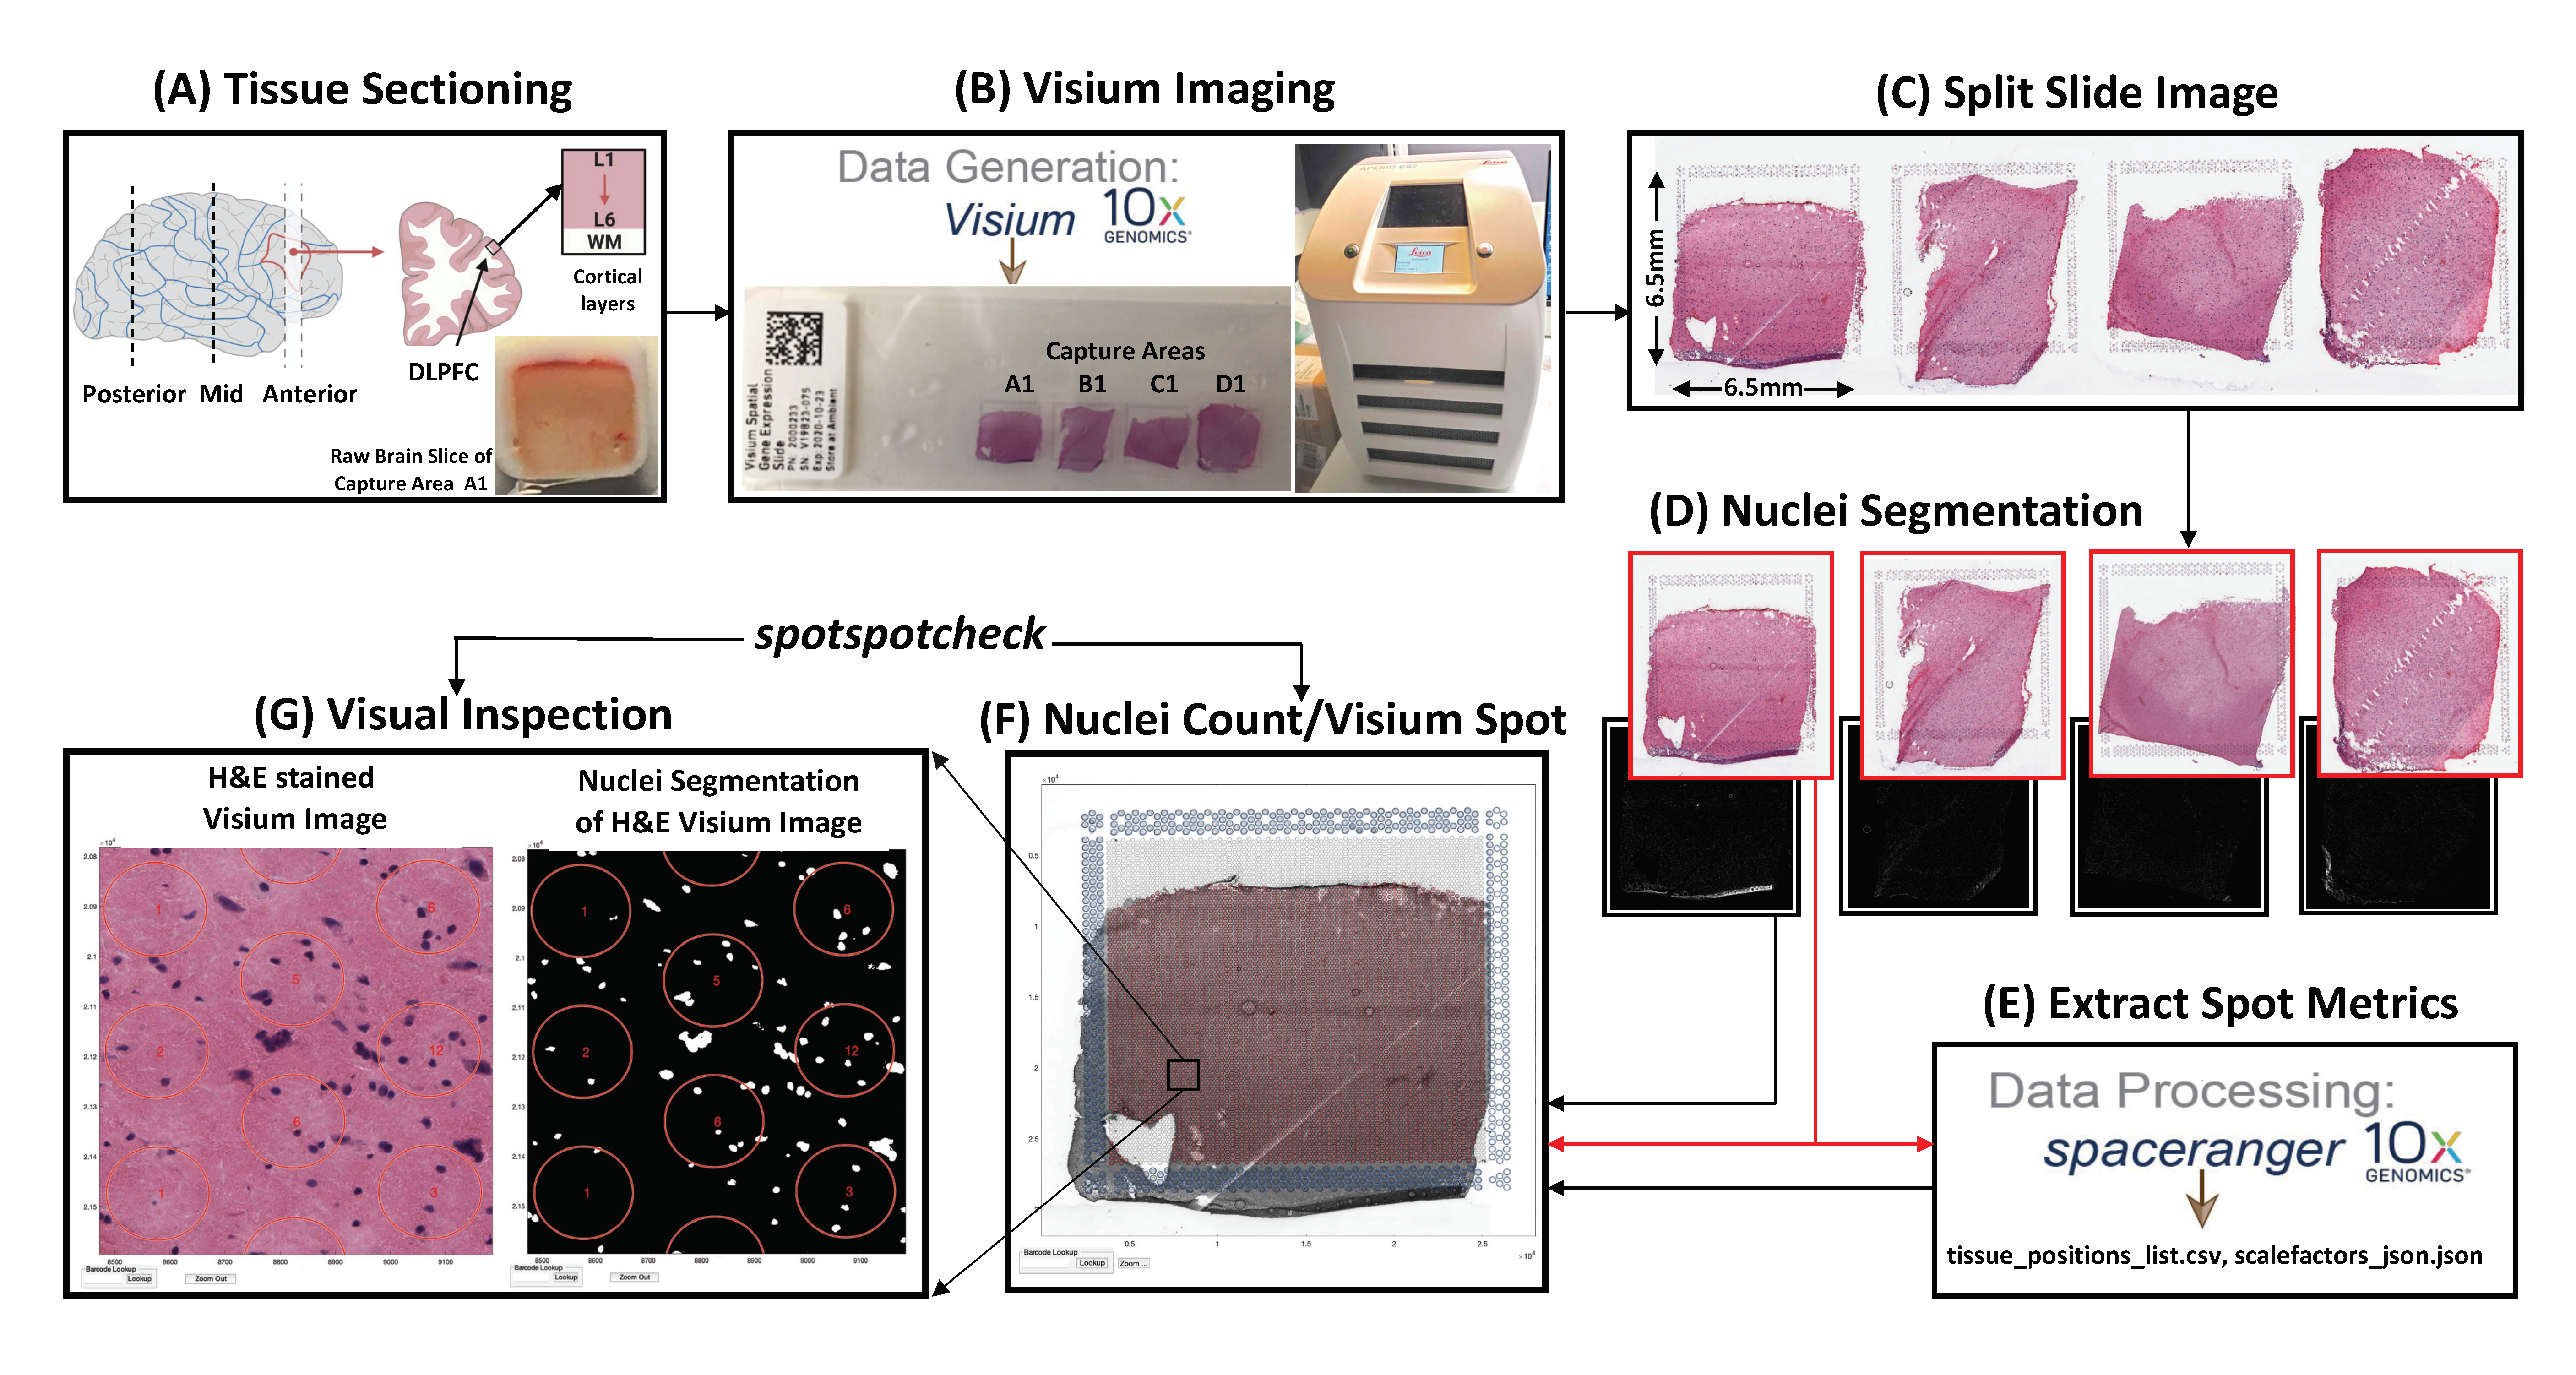 The above figure describes the
 VistoSeg pipeline, (A) The data presented here is from tissue sections obtained from three levels of the human dorsolateral prefrontal cortex (DLPFC; posterior, middle and anterior). Each tissue section spans the six cortical layers plus the white matter. (B) Shows the original ‘Visium gene expression slide’ with 4 capture areas, and the slide scanner used to image the slide. (C) Shows the large tif file produced by the slide scanner, which is then split into the respective capture areas using the function splitSlide described in Step 1. (D) Shows the individual tif images of capture areas produced by splitSlide, and the corresponding nuclei segmentations produced by the functions VNS (Visium Nuclei Segmentation) and refineVNS explained in Step 2. (E) The tif images from ‘(D)’ serve as input to the Spaceranger module (explained in Step 3), which generates tissue_positions_list.csv file and scalefactors_json.json file that contain ‘Visium spot metrics’. (F) The function countNuclei explained in Step 4, gives the nuclei count per Visium spot info that is stored in tissue_spot_counts.csv file. (G) Finally, the pipeline provides a GUI called spotspotcheck that allows the user to perform visual inspection of the nuclei segmentations by allowing the user to toggle between the Visium and binary images, and also provides zoom in/out options to clearly identify cell bodies within a Visium spot.
Cite VistoSeg
We hope that VistoSeg will be useful for your research. Please use the following information to cite the package and the overall approach. Thank you!
@article {Tippani2022,
    author = {Tippani, Madhavi and Divecha, Heena R. and Catallini II,
        Joseph L. and Kwon, Sang Ho and Weber, Lukas M. and Spangler, Abby and Jaffe,
        Andrew E. and Hicks, Stephanie C. and Martinowich, Keri and
        Collado-Torres, Leonardo and Page, Stephanie C. and Maynard,
        Kristen R.},
    title = {VistoSeg: processing utilities for high-resolution Visium/Visium-IF
    images for spatial transcriptomics data},
    year = {2022},
    doi = {[https://doi.org/10.1101/2021.08.04.452489](https://doi.org/10.1101/2021.08.04.452489)},
    publisher = {TODO},
    URL = {TODO},
    journal = {bioRxiv}
}Initial versions of spotspotcheck and countNuclei were developed by Joseph L. Catallini II.
Image Acquisition
The 10X Visium Spatial Gene Expression Imaging Guidelines are followed for acquiring the images. Images are acquired at 40x magnification using a Leica CS2 slide scanner and saved as ‘.SVS files.’ These ‘.SVS files’ are then exported as ‘TIF files’ for downstream analysis. The entire Visium slide (4 capture areas with fiducial frames), is scanned in a single file (~20GB).
Software Requirements
The pipeline was developed under the following software configuration.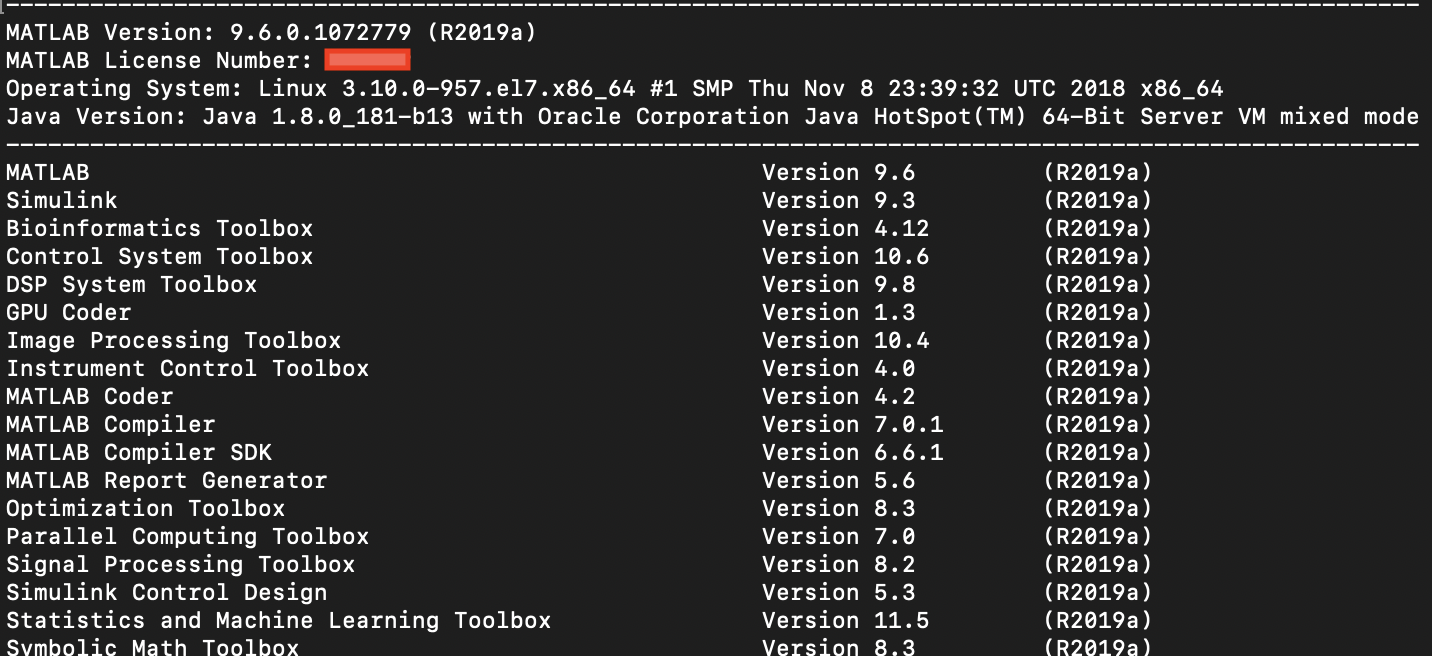
VistoSeg has been tested on Linux, Windows and MacOS.
MATLAB
MATLAB version R2019a 64-bit or later is required to run theVistoSegpipeline with the Image Processing Toolbox preloaded.Memory
Visium whole slide images are high resolution, and the typical size of these multiplane tif images produced in-house is ~25GB. The system RAM (we use ~75GB) should be thrice the size of the multiplane tif image to load it into MATLAB and split them into individual capture areas. The rest of the processing, on individual capture tifs can be performed on a system with as little as 16GB of RAM.Installation
The pipeline is available at https://github.com/LieberInstitute/VistoSeg, which can be download to your system from the Github website directly or the main repository can be cloned to your system using the following command on terminal/command prompt.
git clone https://github.com/LieberInstitute/VistoSeg.gitAll the code exists in the code directory inside the main VistoSeg directory.
The user’s working directory on MATLAB should be the path to the code directory in the downloaded repository, to run any functions this pipeline provides. Once the repository is downloaded, the user can run either of the following code to change their working directory on MATLAB to the code directory.
cd /path_to_the_downloaded_repository/VistoSeg/code/addpath(genpath('/path_to_the_downloaded_repository/VistoSeg/code/'))Getting Help
If you are using VistoSeg and are running into unexpected problems, please report them publicly such that other users might benefit from the answers. Thank you!
Data Availability
The raw Visium .tif file is available at through AWS.
Other potential datasets
1. LIBD pilot DLPFC
2. 10x Genomics spatial data sets
3. All input files and output files for the samples images used in every step in the pipeline are provided at the end of the section.