Spatial plots of discrete or continuous features for stitched-together capture areas.
Source:R/spot_plot.R
spot_plot.RdThis function is essentially a wrapper around spatialLIBD::vis_clus and
spatialLIBD::vis_gene, suitable for merged samples (each sample in the
SpatialExperiment 'spe' is a donor consisting of multiple capture areas, with
colData column 'exclude_overlapping' indicating overlapping spots to drop (to
prevent overplotting).
Arguments
- spe
A
SpatialExperimentwith colData columnexclude_overlapping, passed tospatialLIBD::vis_geneorspatialLIBD::vis_clus- sample_id
character(1) passed to
sampleidinspatialLIBD::vis_geneorspatialLIBD::vis_clus. Assumed to be a donor, possibly consisting of several capture areas to plot at once- image_id
character(1) giving the name of the image (e.g. "lowres") to plot, used both to determine an appropriate spot size and passed to
spatialLIBD::vis_geneorspatialLIBD::vis_clus- title
character(1) giving the title of the plot
- var_name
character() passed to
geneidforspatialLIBD::vis_geneor character(1) passed toclustervarforspatialLIBD::vis_clus- multi_gene_method
A
character(1): either "pca", "sparsity", or "z_score". This parameter controls how multiple continuous variables are combined for visualization, and only applies whenvar_namehas length > 1 andis_discreteis FALSE- include_legend
logical(1): if FALSE, remove the plot legend
- is_discrete
logical(1): if TRUE, use
spatialLIBD::vis_clus; otherwise, usespatialLIBD::vis_gene- colors
character() of colors passed to
colorsforspatialLIBD::vis_clusifis_discreteor otherwise tocont_colorsforspatialLIBD::vis_gene- assayname
character(1) passed to
spatialLIBD::vis_geneif notis_discrete- minCount
numeric(1) passed to passed to
spatialLIBD::vis_geneif notis_discrete- spatial
logical(1) passed to
sampleidinspatialLIBD::vis_geneorspatialLIBD::vis_clus
Value
A ggplot object containing a "spot plot" of the specified sample
Details
Spot sizes are almost consistent among donors, regardless of full- resolution image dimensions, when title is NULL, include_legend is FALSE, and the plot is saved to a square output (e.g. PDF with 7in width and height). However, ggplot does not seem to scale plots of different aspect ratios exactly consistently when writing to PDF (untested for other formats)
Examples
# Grab an example SpatialExperiment and suppose all of its spots should be
# plotted (for spatialNAc, 'exclude_overlapping' will only have genuinely
# overlapping spots be TRUE)
spe <- if (!exists("spe")) {
spatialLIBD::fetch_data(type = "spatialDLPFC_Visium_example_subset")
}
#> 2024-06-06 17:41:16.613515 loading file /github/home/.cache/R/BiocFileCache/6fb23c6a6be_spatialDLPFC_spe_subset_example.rds%3Fdl%3D1
spe$exclude_overlapping <- FALSE
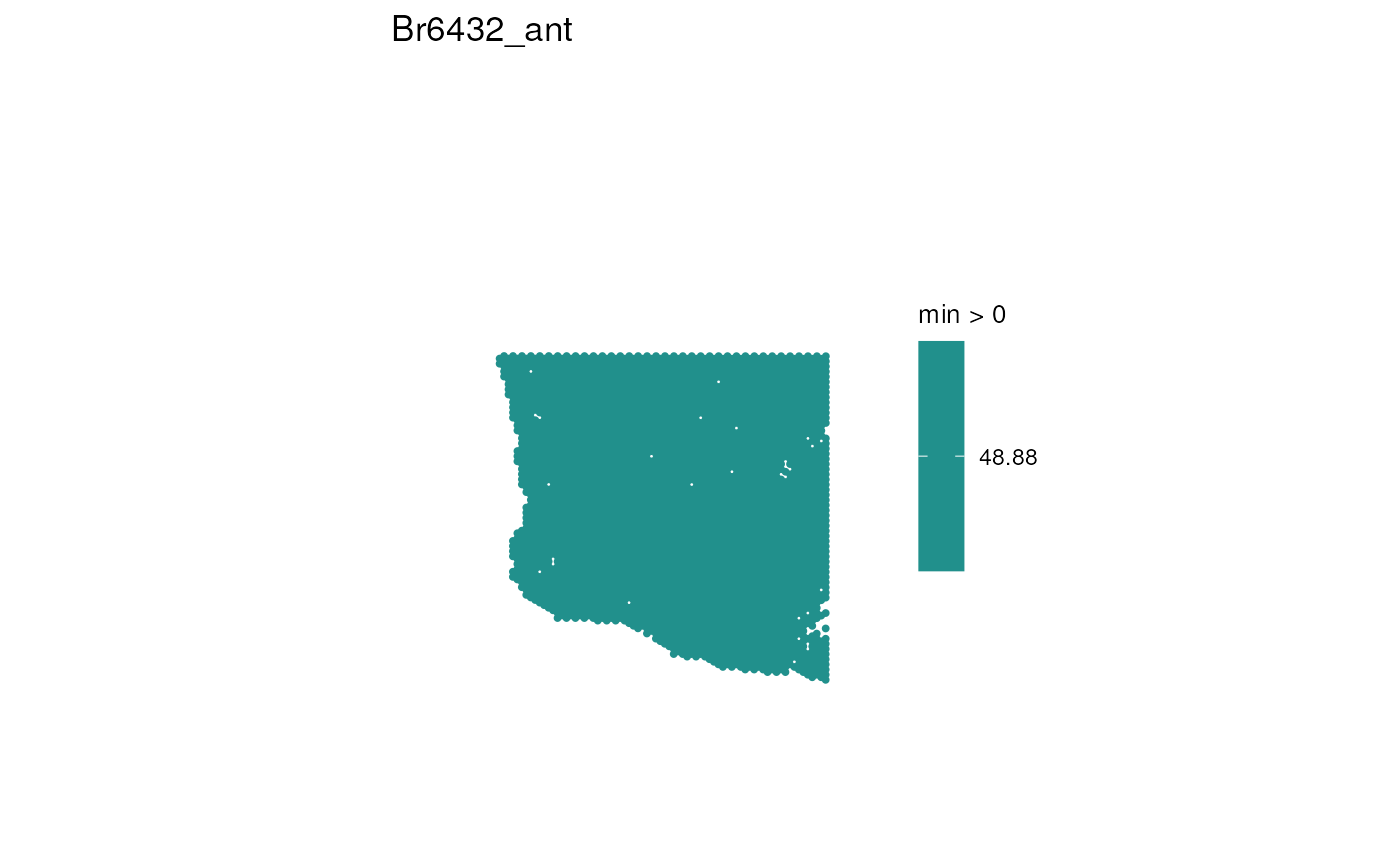
# Plot age spatially for the first sample
sample_id <- unique(spe$sample_id)[1]
p <- spot_plot(
spe,
sample_id = sample_id,
title = sample_id, var_name = "age",
include_legend = TRUE, is_discrete = FALSE, minCount = 0,
assayname = "logcounts"
)
print(p)
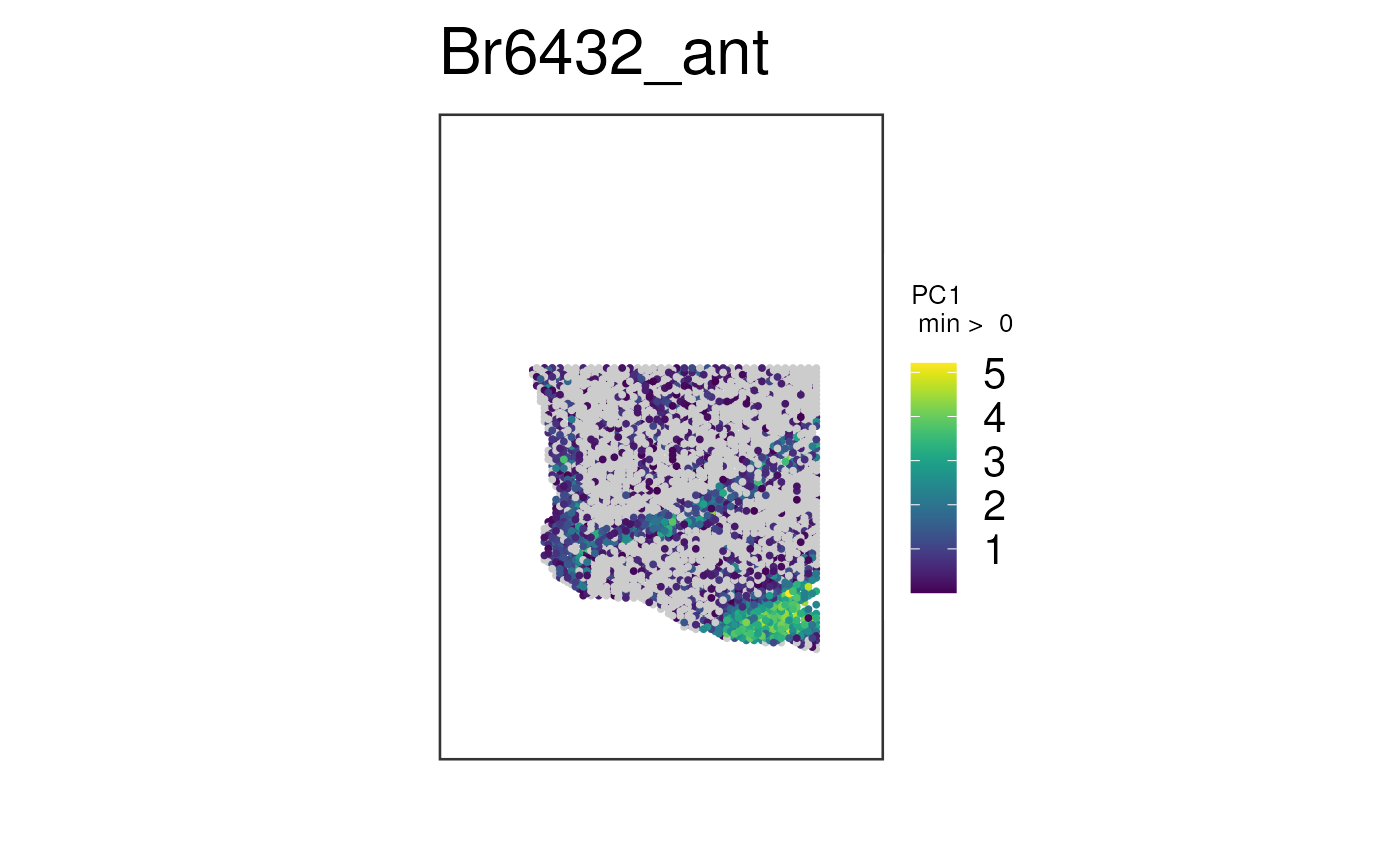
 # Define several markers for white matter
white_matter_genes <- c(
"ENSG00000197971", "ENSG00000131095", "ENSG00000123560",
"ENSG00000171885"
)
# Plot multiple white matter genes simultaneously for the first sample.
# Use the "pca" method for combining them
p <- spot_plot(
spe,
sample_id = sample_id,
title = sample_id, var_name = white_matter_genes,
multi_gene_method = "pca", include_legend = TRUE, is_discrete = FALSE,
minCount = 0, assayname = "logcounts"
)
print(p)
# Define several markers for white matter
white_matter_genes <- c(
"ENSG00000197971", "ENSG00000131095", "ENSG00000123560",
"ENSG00000171885"
)
# Plot multiple white matter genes simultaneously for the first sample.
# Use the "pca" method for combining them
p <- spot_plot(
spe,
sample_id = sample_id,
title = sample_id, var_name = white_matter_genes,
multi_gene_method = "pca", include_legend = TRUE, is_discrete = FALSE,
minCount = 0, assayname = "logcounts"
)
print(p)