Differential Expression Analysis
9/18/2020
1 Analysis
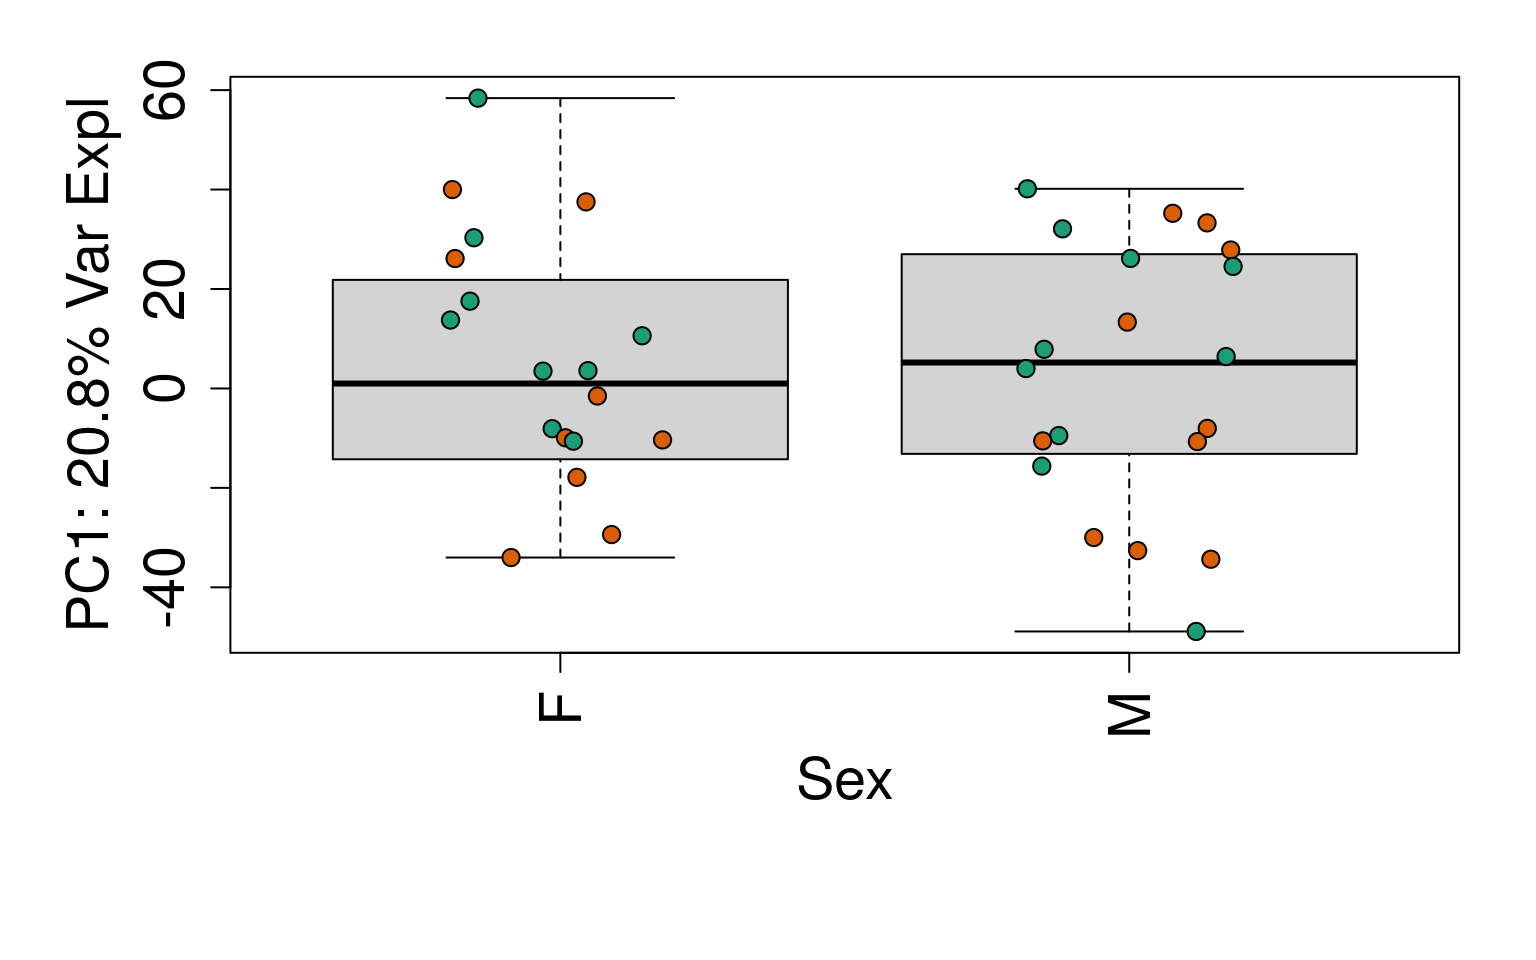
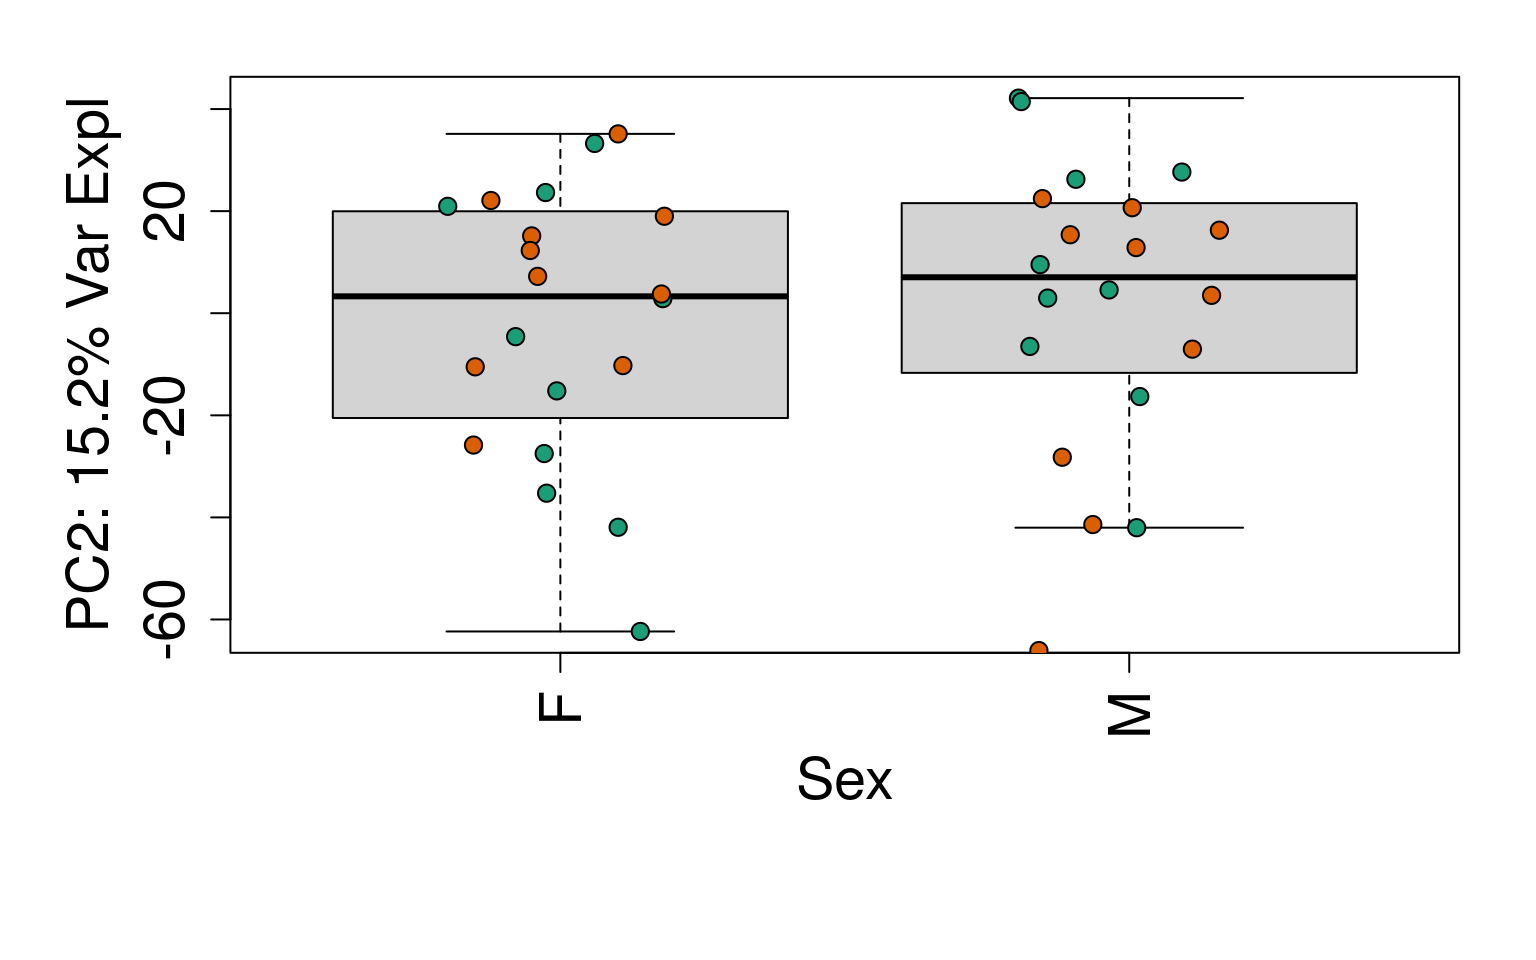
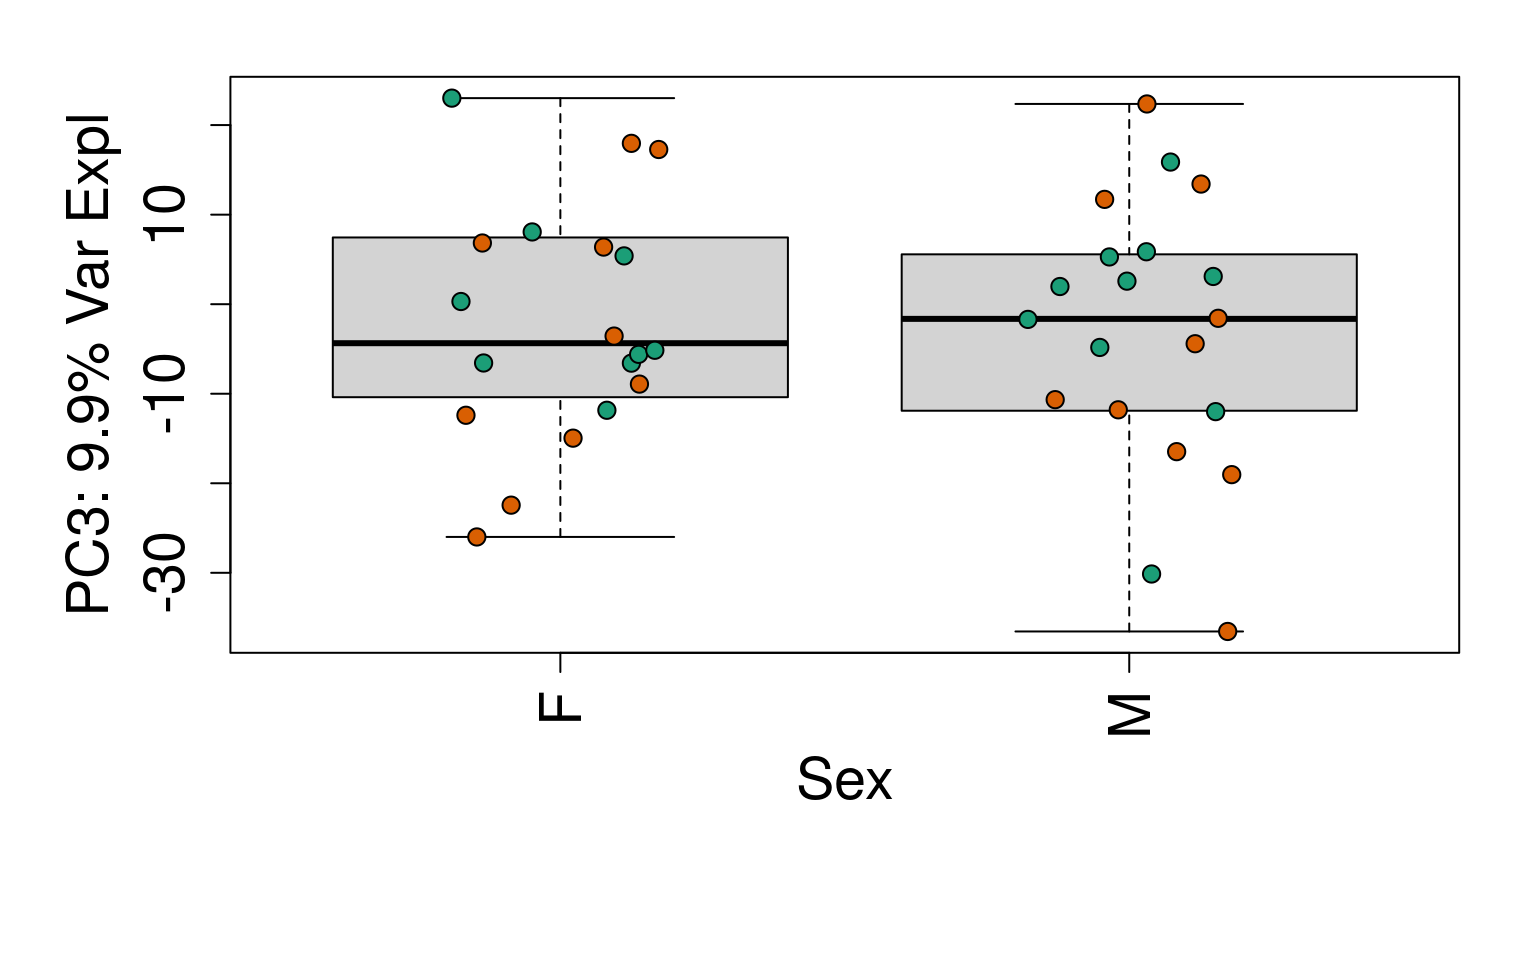
The following analysis explores a RangedSummarizedExperiment object from the SPEAQeasy pipeline. Note that we will use a modified version of the object, which resolved sample identity issues which were present in the raw output from SPEAQeasy. This object also includes phenotype data added after resolving identity issues. Though SPEAQeasy produces objects for several feature types (genes, exons, exon-exon junctions), we will demonstrate an example analysis for just genes. We will perform differential expression across some typical variables of interest (e.g. sex, age, race) and show how to perform principal component analysis (PCA) and visualize findings with plots.
1.1 Load required libraries
library("SummarizedExperiment")
library("recount")
library("edgeR")
library("limma")
library("jaffelab") # GitHub: LieberInstitute/jaffelab
library("RColorBrewer")
library("clusterProfiler")
library("org.Hs.eg.db")
library("pheatmap")
library("here")
library("devtools")
library("BiocStyle")
1.2 Load data and prepare directories to place outputs in
For those who ran SPEAQeasy from the example FASTQ data set, the RangedSummarizedExperiment will have a different path, as specified with the --output flag.
# Load the RSE gene object
load(here("rse_speaqeasy.RData"), verbose = TRUE)
## Loading objects:
## rse_gene# Create directories to organize outputs from this analysis
dir.create(here("DE_analysis", "pdfs"), showWarnings = FALSE)
dir.create(here("DE_analysis", "tables"), showWarnings = FALSE)
dir.create(here("DE_analysis", "rdas"), showWarnings = FALSE)
## Clean up the PrimaryDx variable
rse_gene$PrimaryDx <- factor(rse_gene$PrimaryDx)1.3 statistics PCs
Here we are using principal component analysis to control for the listed variables impact on expression. This will be later added into our linear model.
col_names <- c(
    "trimmed",
    "numReads",
    "numMapped",
    "numUnmapped",
    "overallMapRate",
    "concordMapRate",
    "totalMapped",
    "mitoMapped",
    "mitoRate",
    "totalAssignedGene"
)
set.seed(20201006)
statsPca <- prcomp(as.data.frame(colData(rse_gene)[, col_names]))
rse_gene$PC <- statsPca$x[, 1]
getPcaVars(statsPca)[1]
## [1] 87.31.4 Stats vs. diagnosis and brain region
Here we explore the relationship between some quality control covariates produced by SPEAQeasy against phenotype data that we have on the samples such as brain region, primary diagnosis and race.
## We only have one race here
table(rse_gene$Race)
##
## CAUC
## 40# Check if certain statistics changed by primary diagnosis or brain region
# Display box plots here
create_boxplots <- function() {
boxplot(rse_gene$rRNA_rate ~ rse_gene$BrainRegion, xlab = "")
boxplot(rse_gene$mitoRate ~ rse_gene$BrainRegion, xlab = "")
boxplot(rse_gene$gene_Assigned ~ rse_gene$BrainRegion, xlab = "")
boxplot(rse_gene$mitoRate ~ rse_gene$PrimaryDx,
las = 3,
xlab = ""
)
boxplot(rse_gene$gene_Assigned ~ rse_gene$PrimaryDx,
las = 3,
xlab = ""
)
boxplot(rse_gene$mitoRate ~ rse_gene$PrimaryDx + rse_gene$BrainRegion,
las = 3,
xlab = ""
)
boxplot(rse_gene$gene_Assigned ~ rse_gene$PrimaryDx + rse_gene$BrainRegion,
las = 3,
xlab = ""
)
return(NULL)
}
# Save box plots to PDF
pdf(file = here("DE_analysis", "pdfs", "Region_Dx_cellcheck.pdf"))
create_boxplots()## NULLdev.off()## png
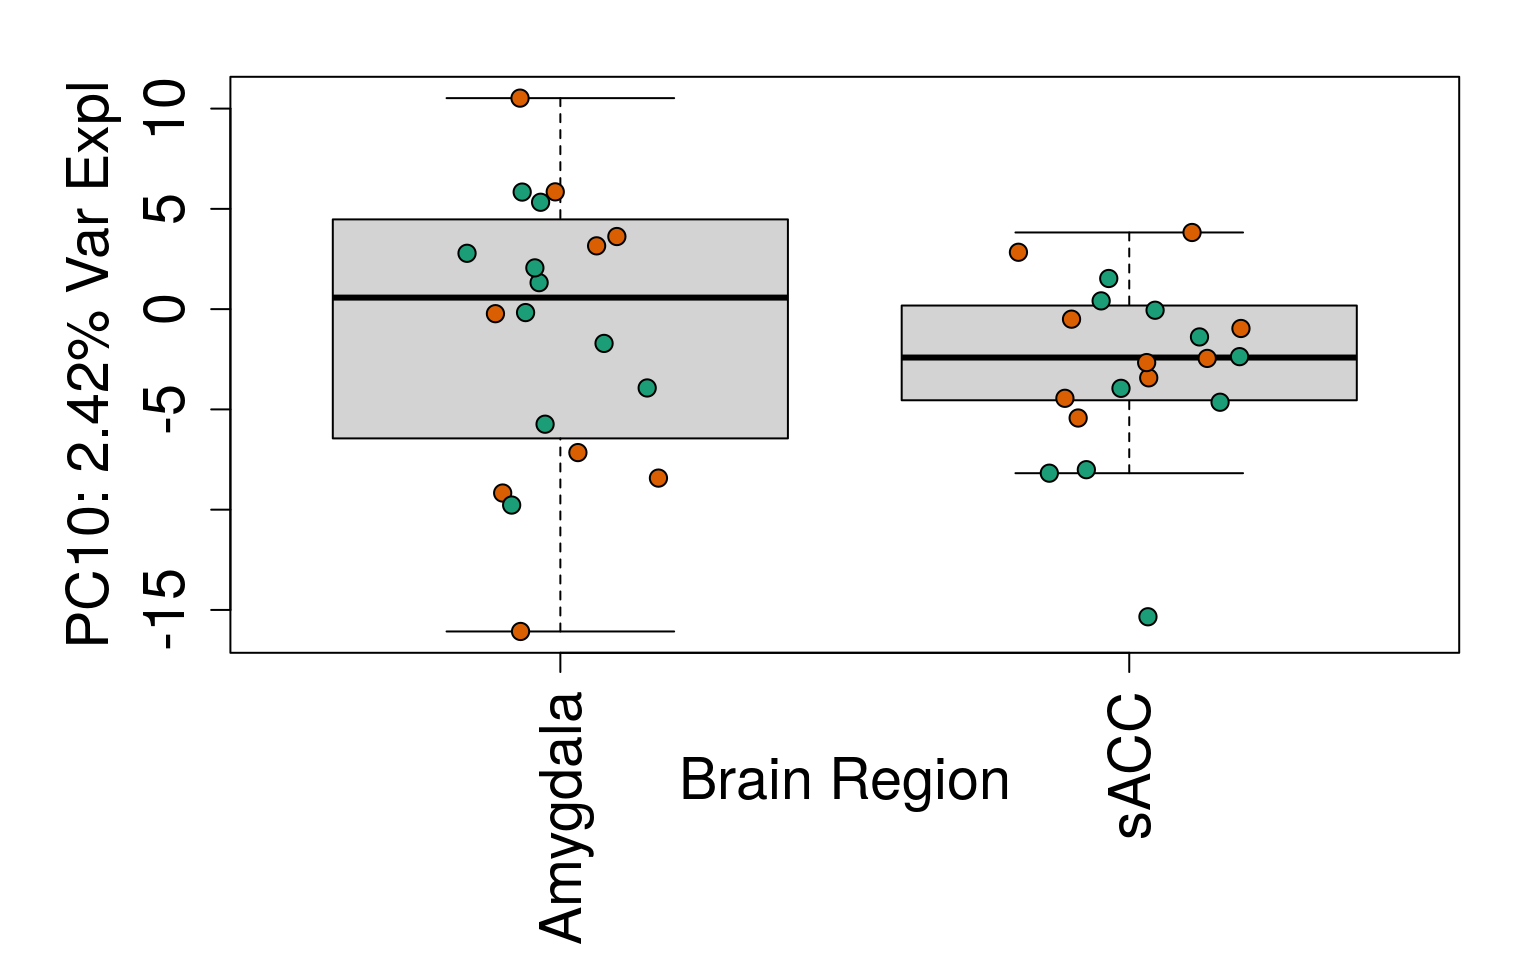
## 21.5 Explore and visualize gene expression
# Filter for expressed
rse_gene <- rse_gene[rowMeans(getRPKM(rse_gene, "Length")) > 0.2, ]

# Explore gene expression
geneExprs <- log2(getRPKM(rse_gene, "Length") + 1)
set.seed(20201006)
pca <- prcomp(t(geneExprs))
pca_vars <- getPcaVars(pca)
pca_vars_lab <- paste0(
    "PC", seq(along = pca_vars), ": ",
    pca_vars, "% Var Expl"
)

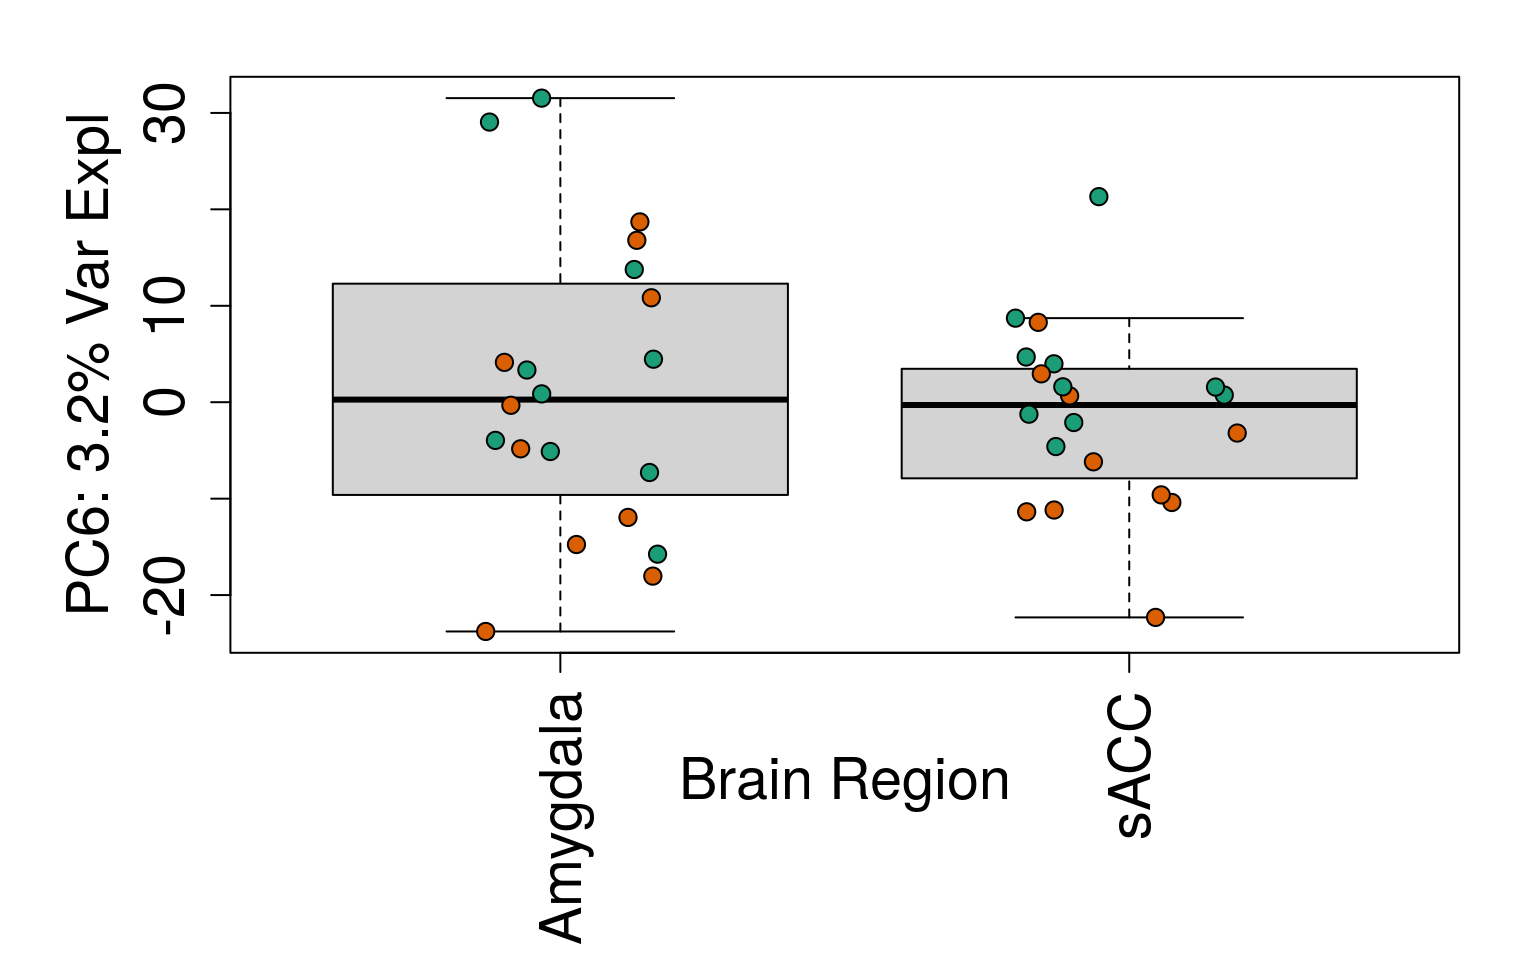
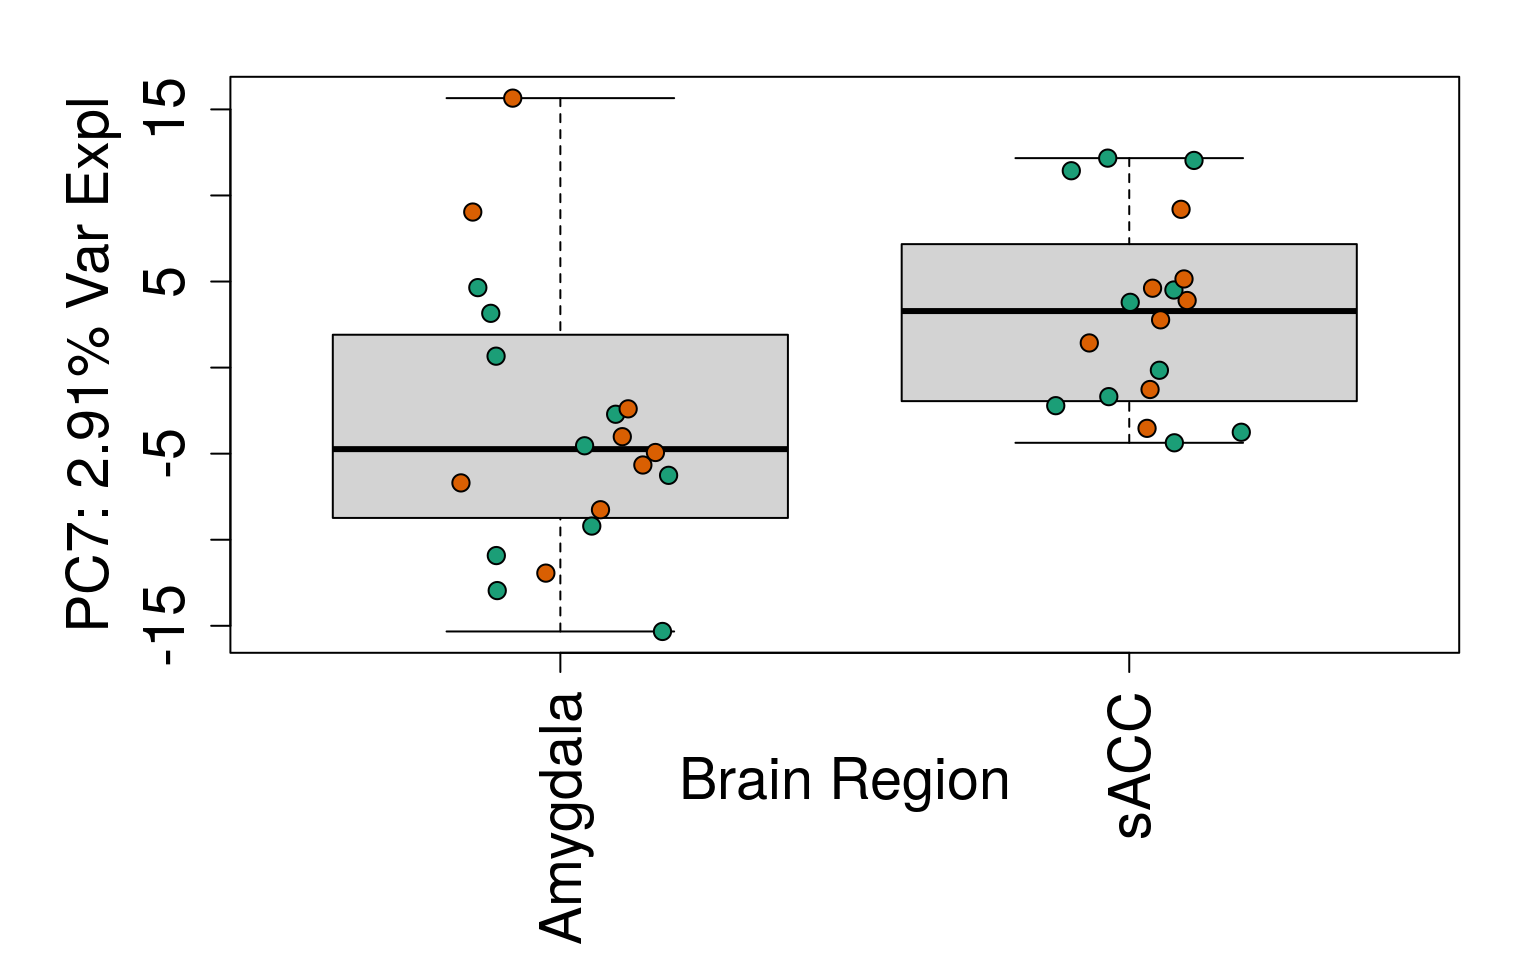
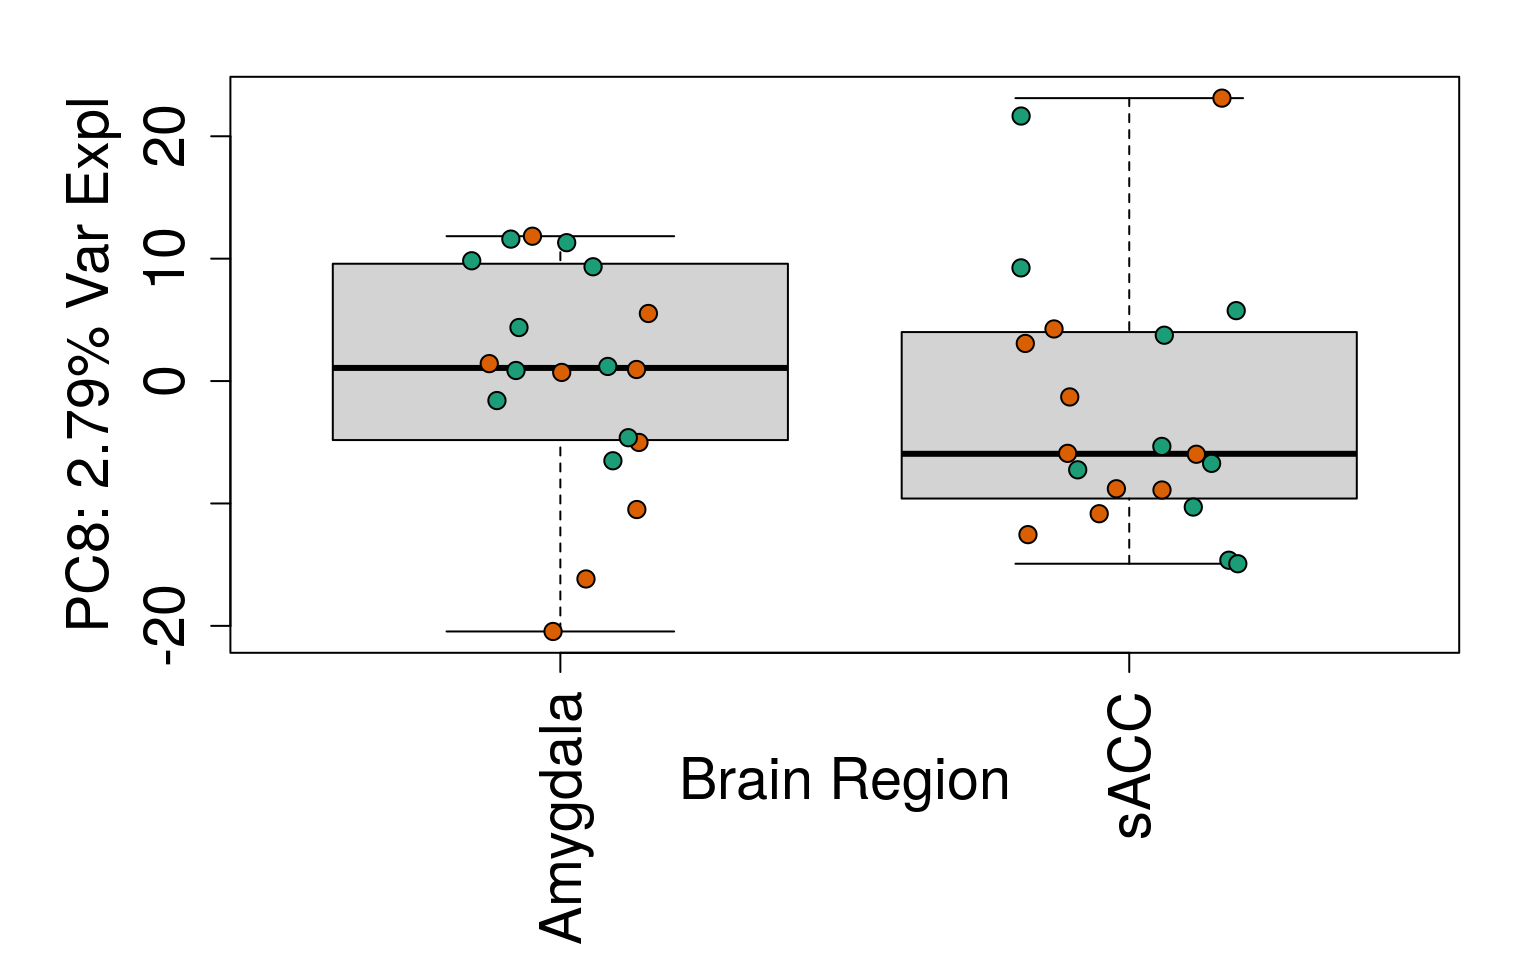
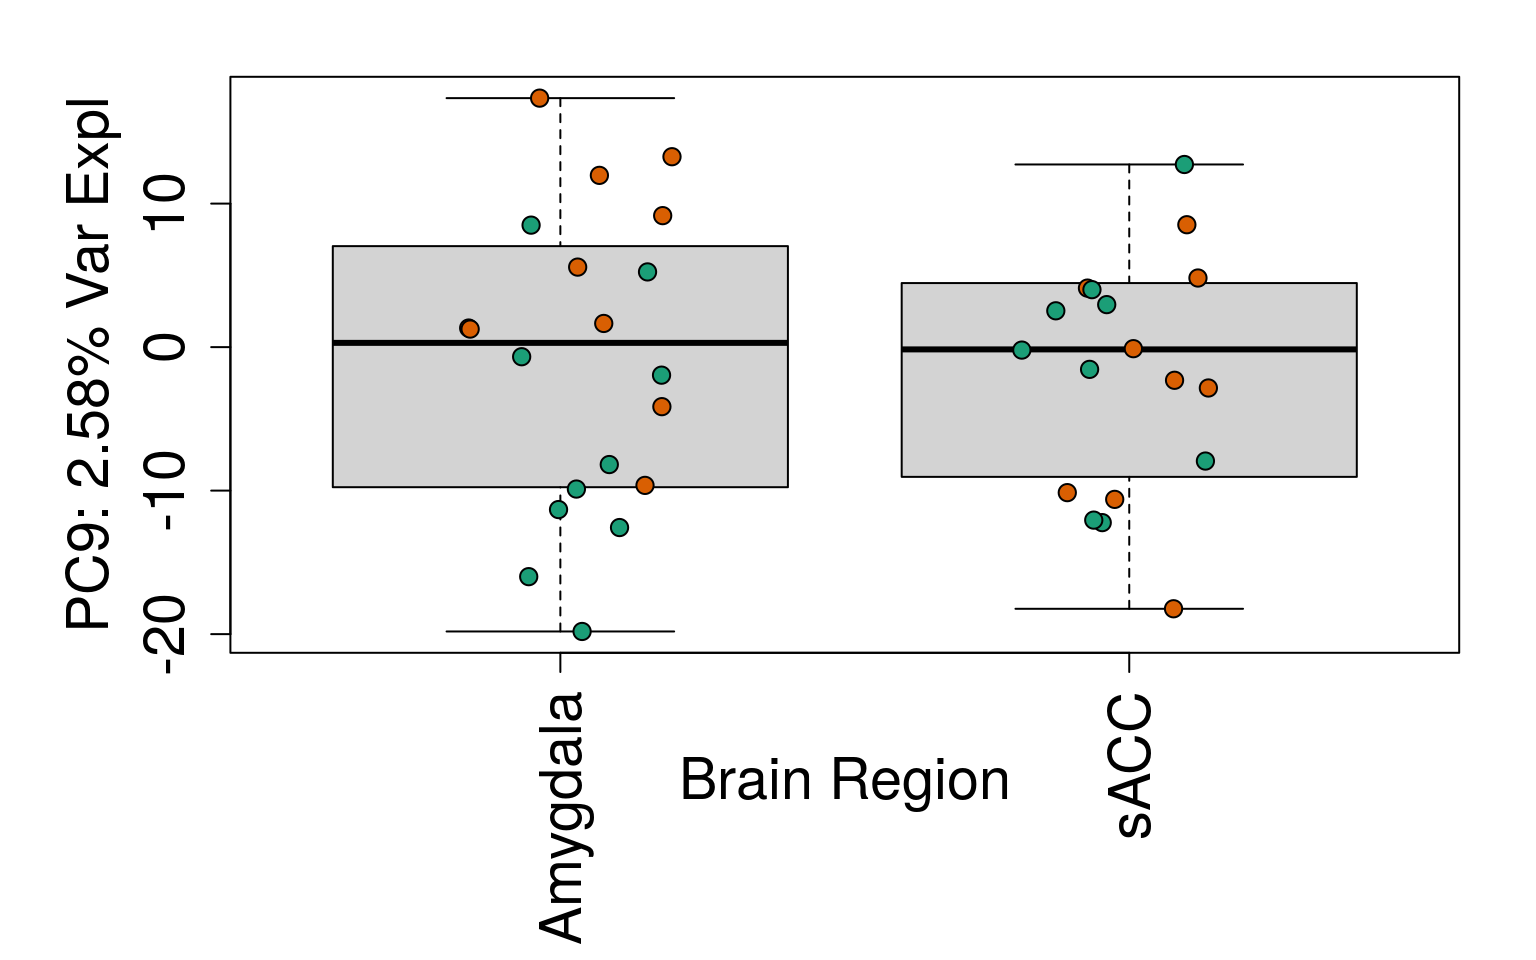
# Group together code for generating plots of interest
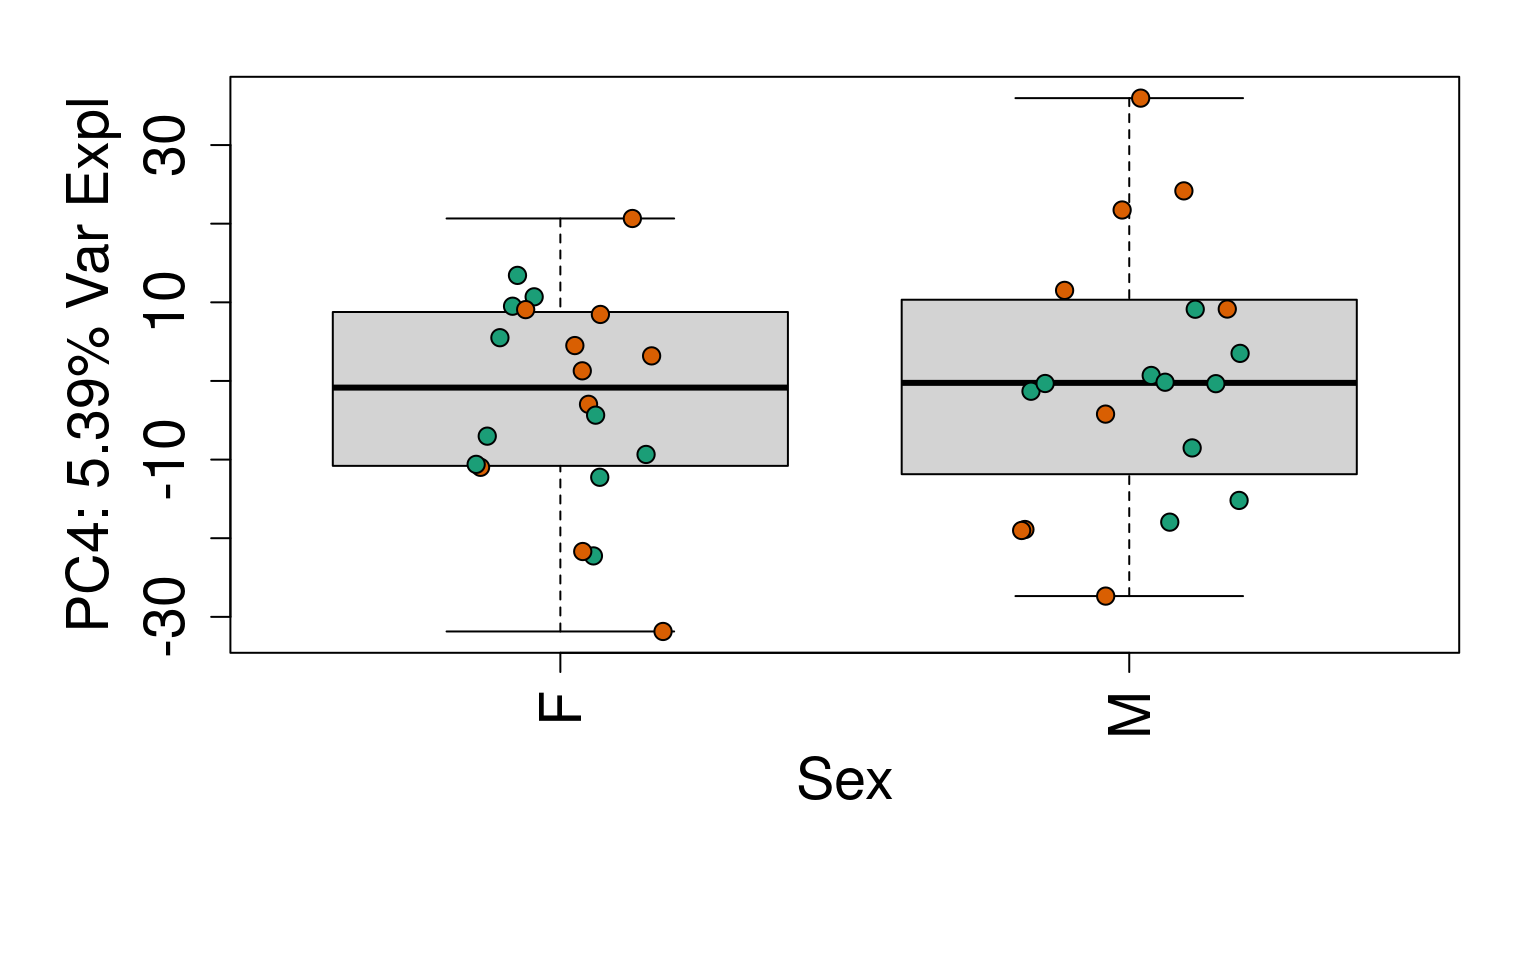
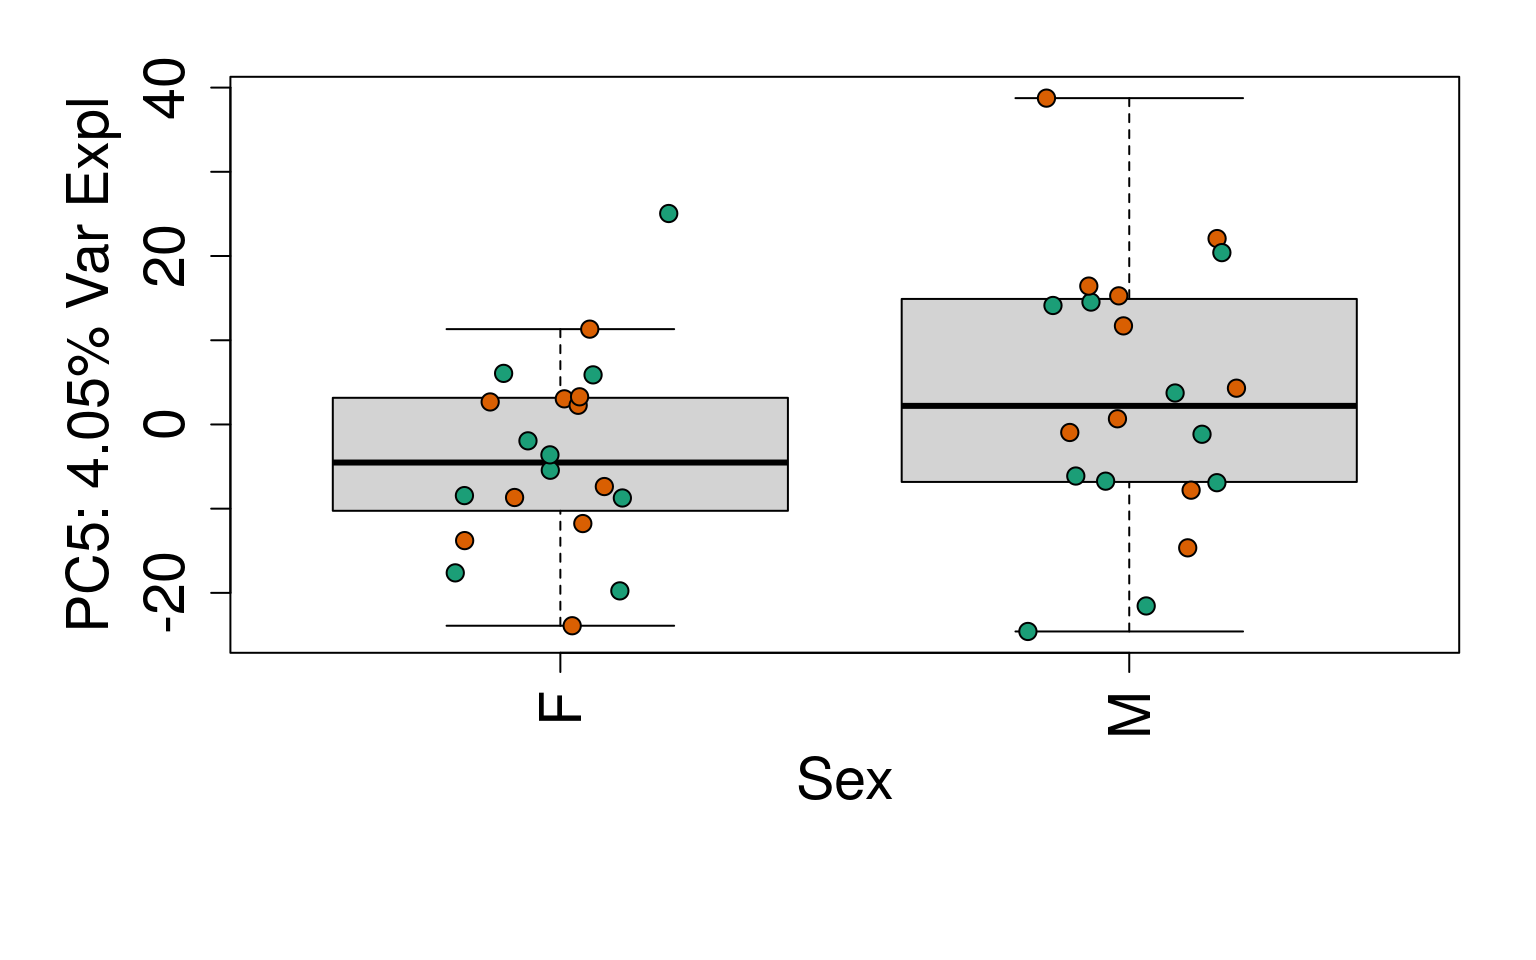
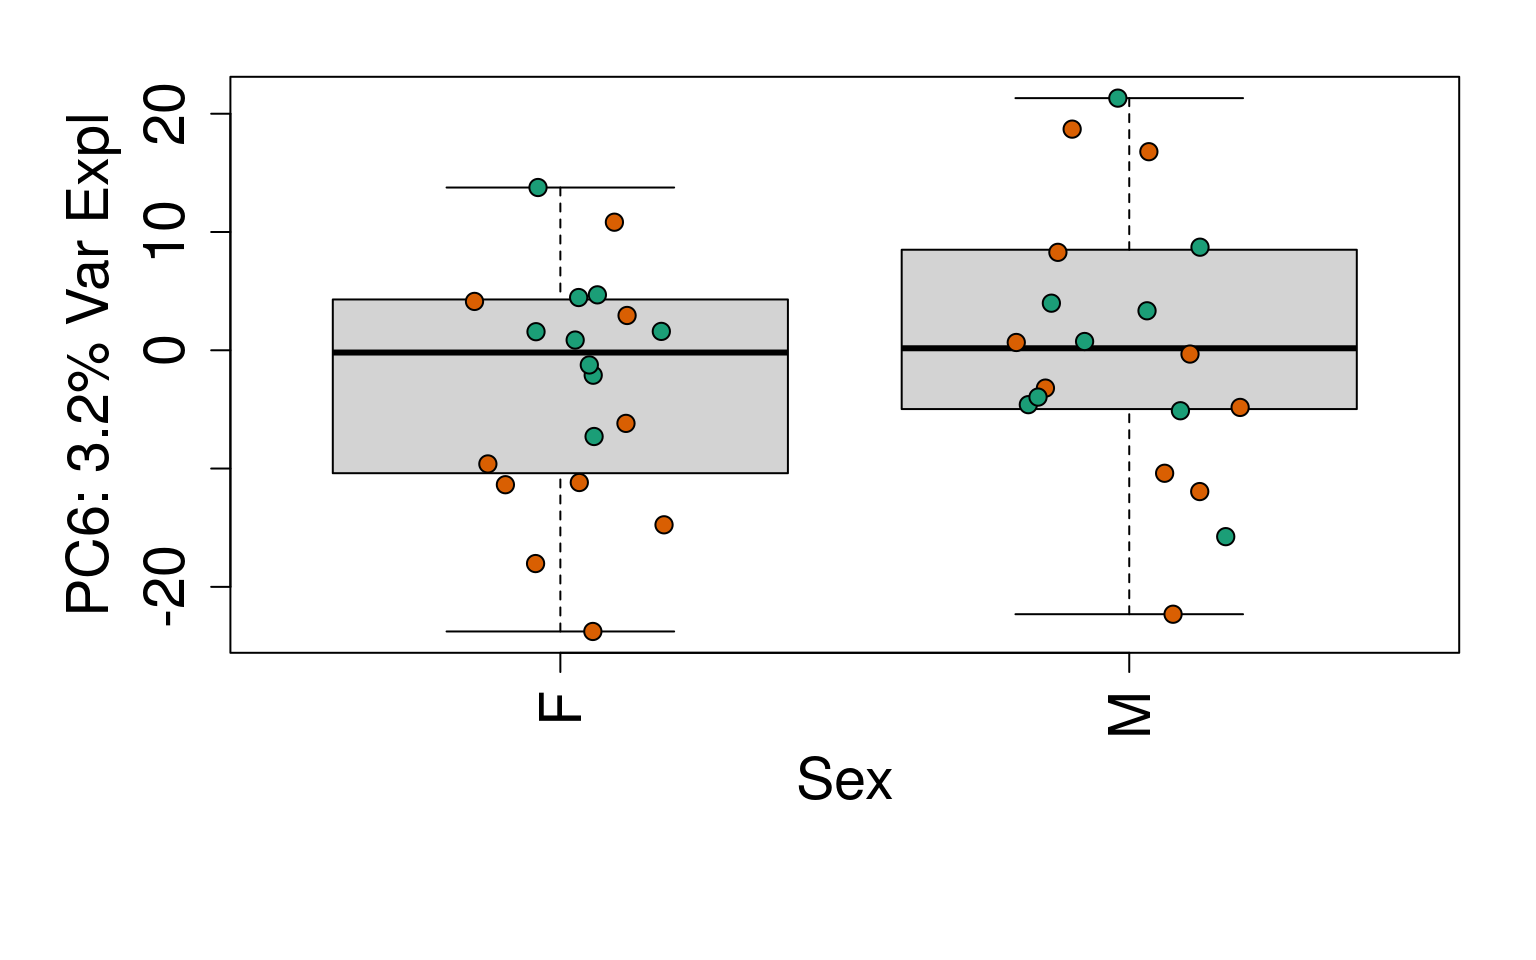
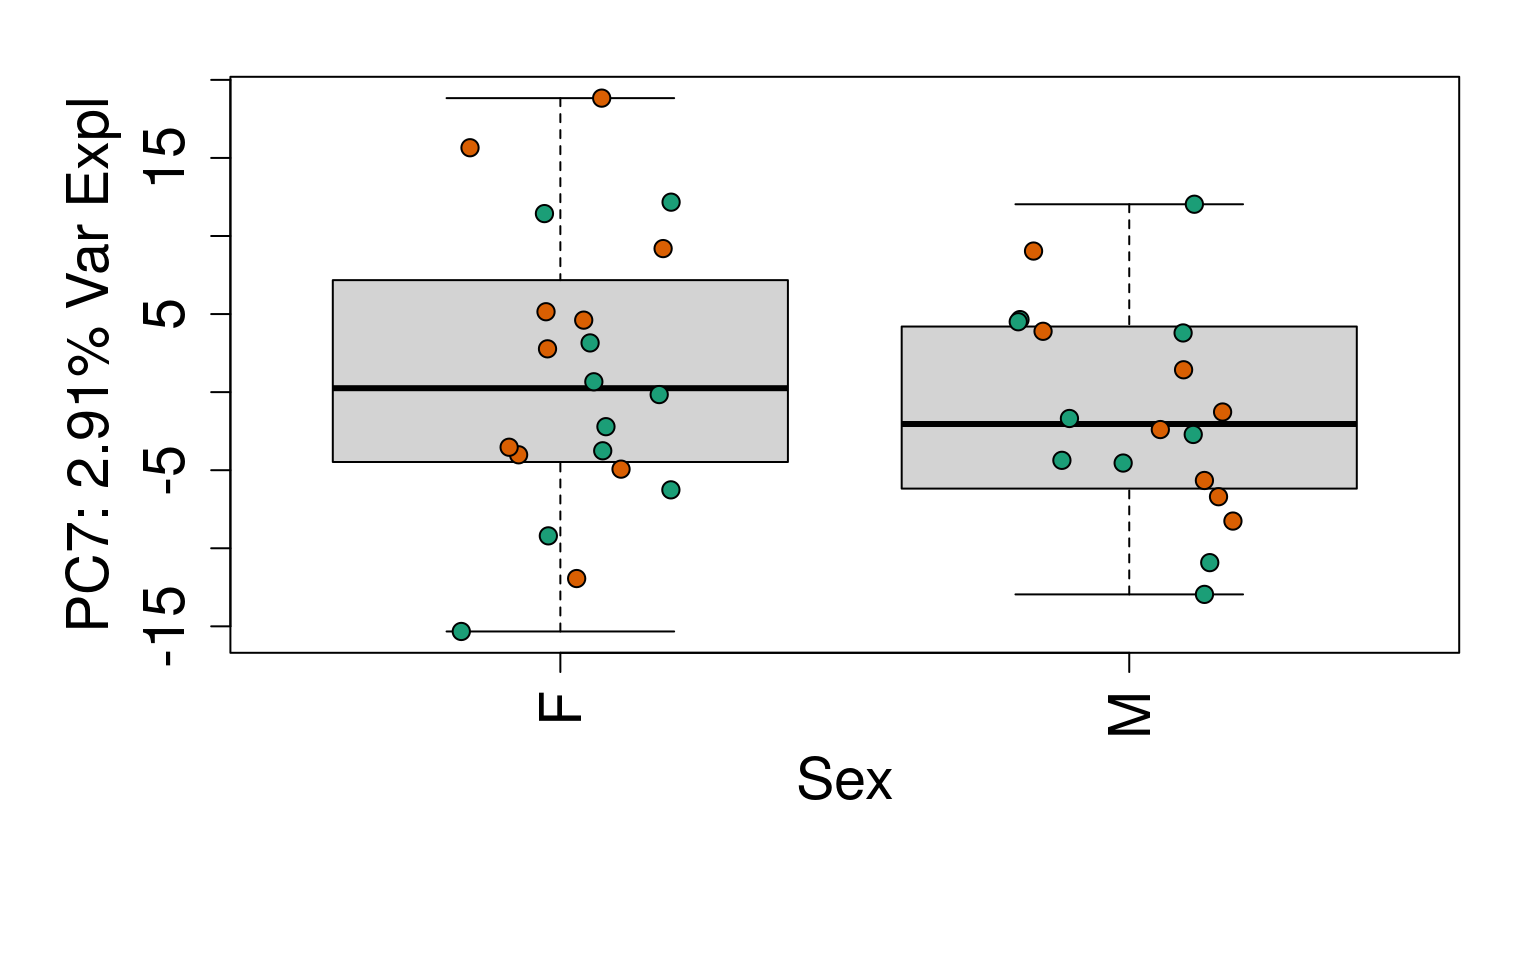
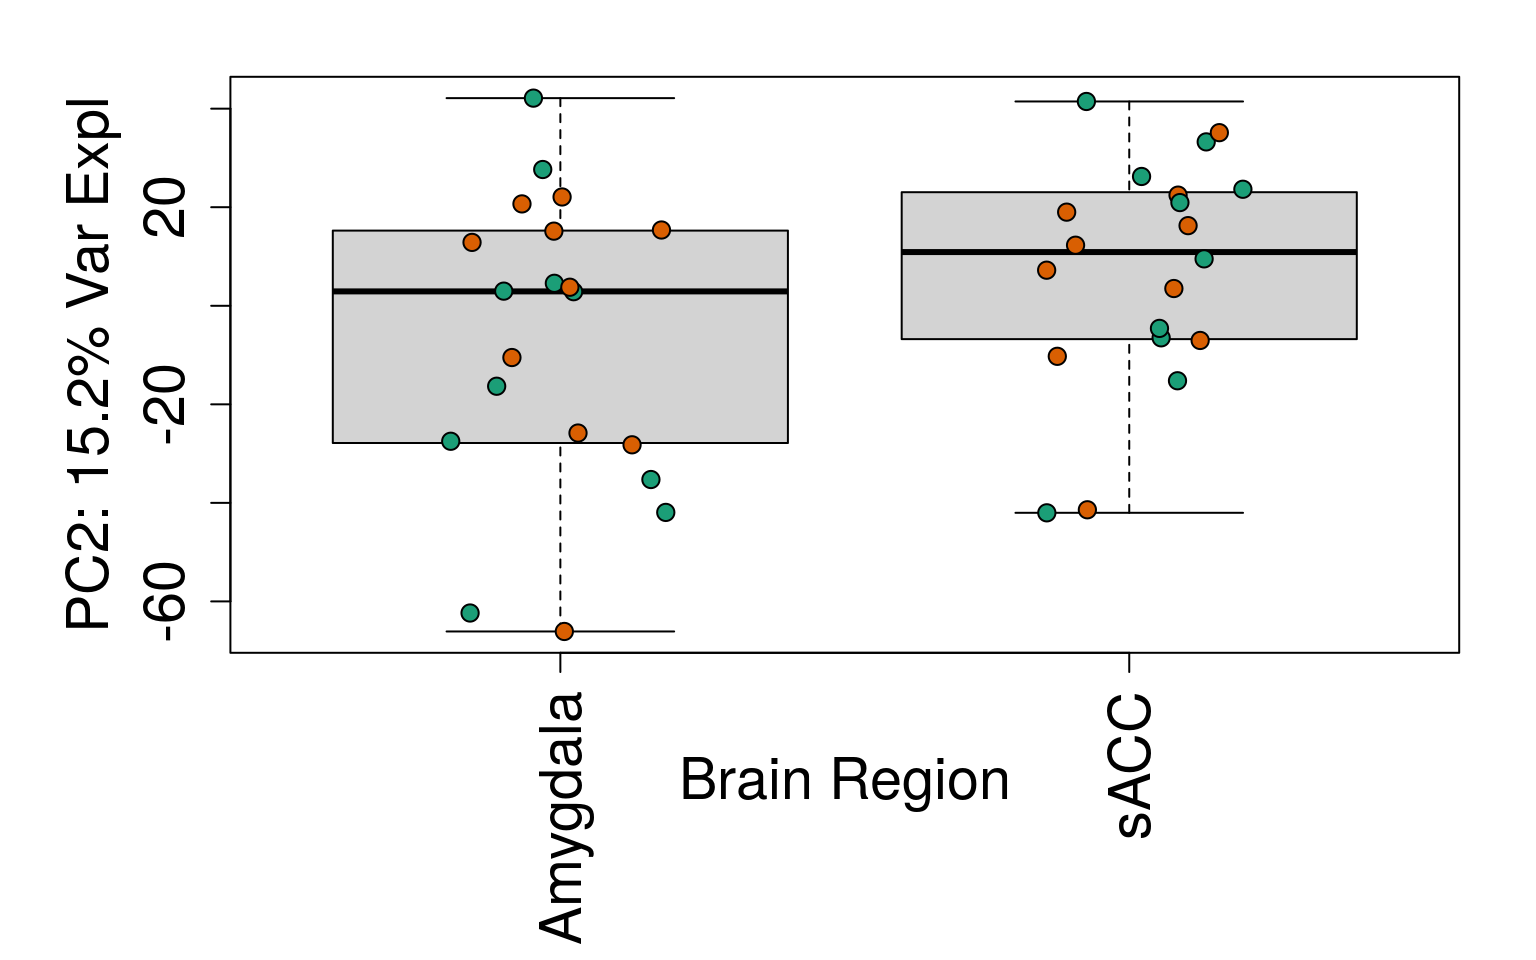
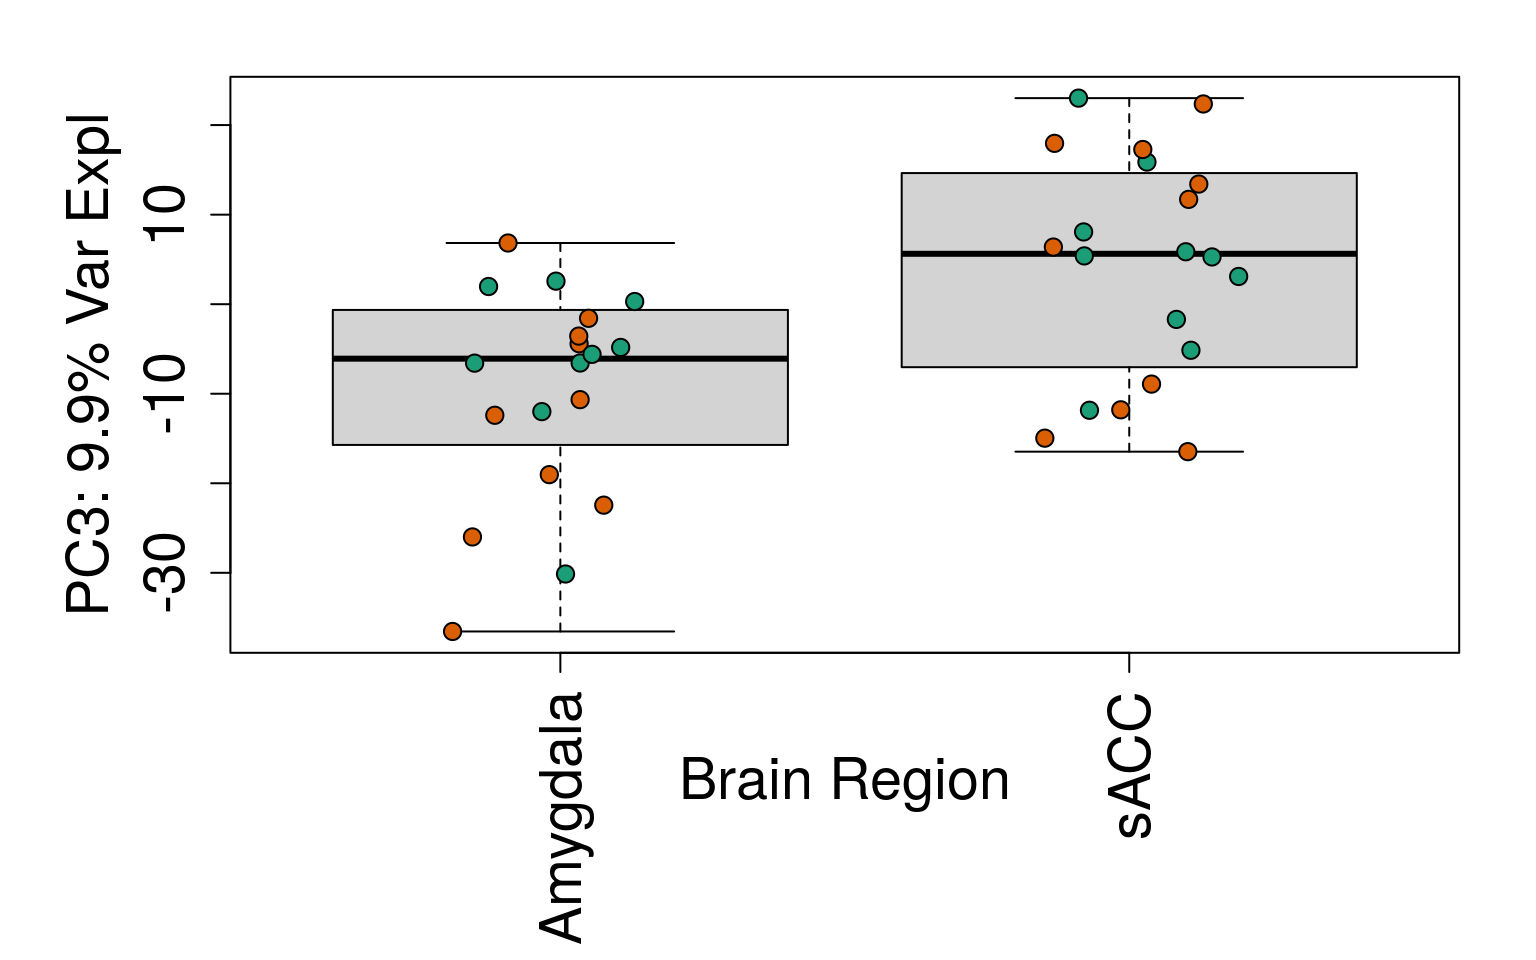
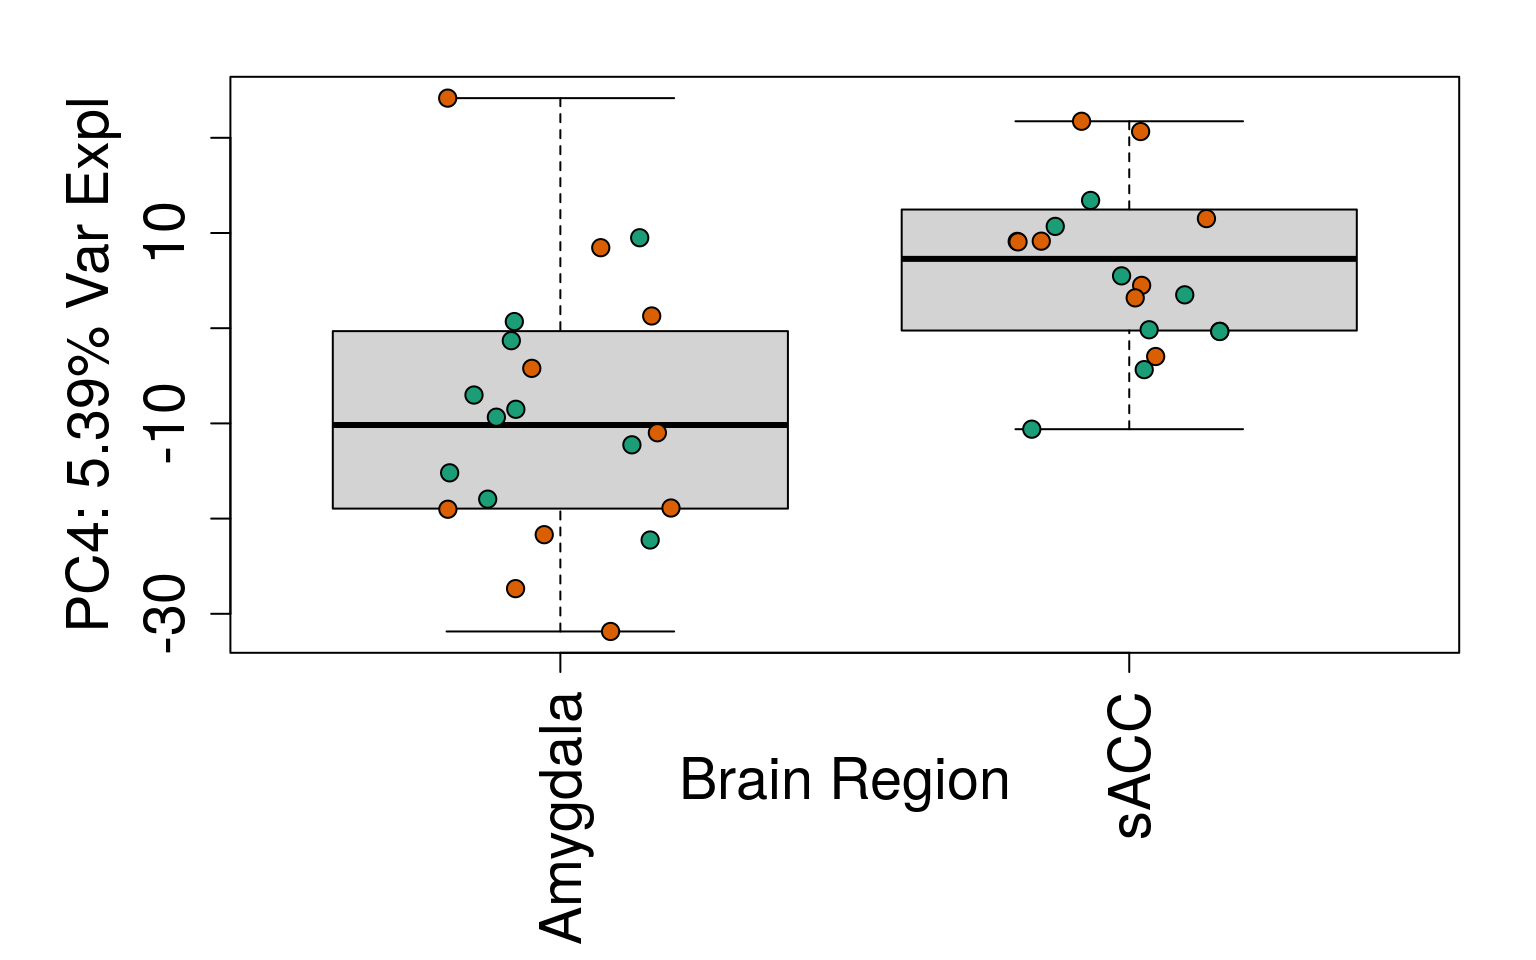
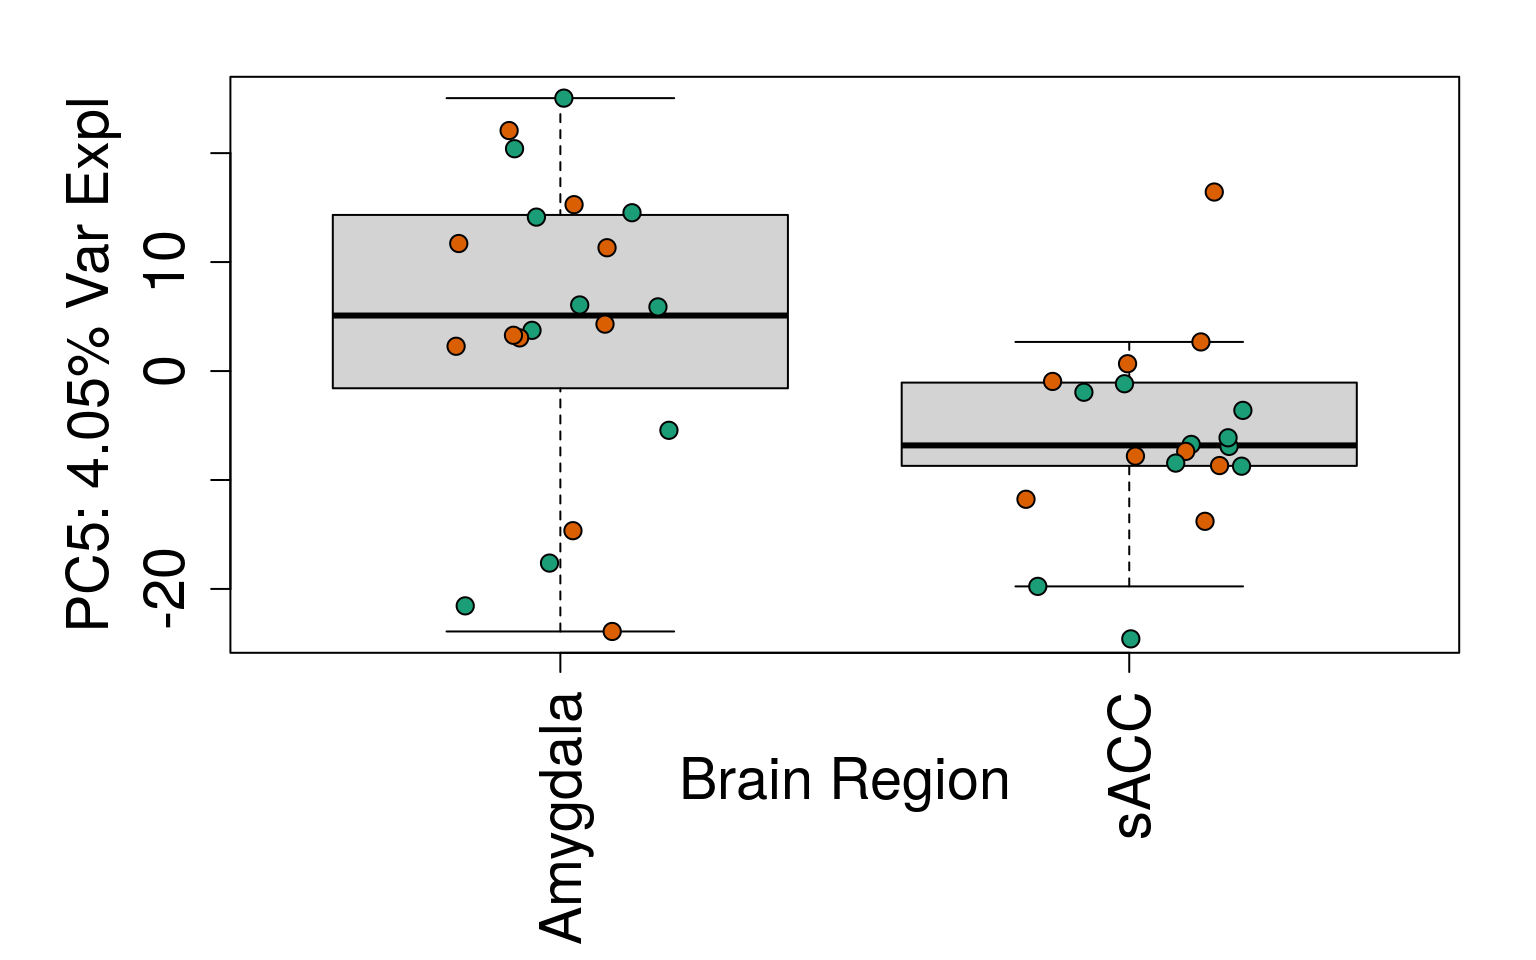
generate_plots <- function() {
    par(
        mar = c(8, 6, 2, 2),
        cex.axis = 1.8,
        cex.lab = 1.8
    )
    palette(brewer.pal(4, "Dark2"))

    # PC1 vs. PC2
    plot(
        pca$x,
        pch = 21,
        bg = factor(rse_gene$PrimaryDx),
        cex = 1.2,
        xlab = pca_vars_lab[1],
        ylab = pca_vars_lab[2]
    )
    legend(
        "bottomleft",
        levels(rse_gene$PrimaryDx),
        col = 1:2,
        pch = 15,
        cex = 2
    )

    # By line
    for (i in 1:10) {
        boxplot(
            pca$x[, i] ~ rse_gene$Sex,
            ylab = pca_vars_lab[i],
            las = 3,
            xlab = "Sex",
            outline = FALSE
        )
        points(
            pca$x[, i] ~ jitter(as.numeric(factor(
                rse_gene$Sex
            ))),
            pch = 21,
            bg = rse_gene$PrimaryDx,
            cex = 1.2
        )
    }

    # By brain region
    for (i in 1:10) {
        boxplot(
            pca$x[, i] ~ rse_gene$BrainRegion,
            ylab = pca_vars_lab[i],
            las = 3,
            xlab = "Brain Region",
            outline = FALSE
        )
        points(
            pca$x[, i] ~ jitter(as.numeric(factor(
                rse_gene$BrainRegion
            ))),
            pch = 21,
            bg = rse_gene$PrimaryDx,
            cex = 1.2
        )
    }
}

# Display plots
set.seed(20201006)
generate_plots()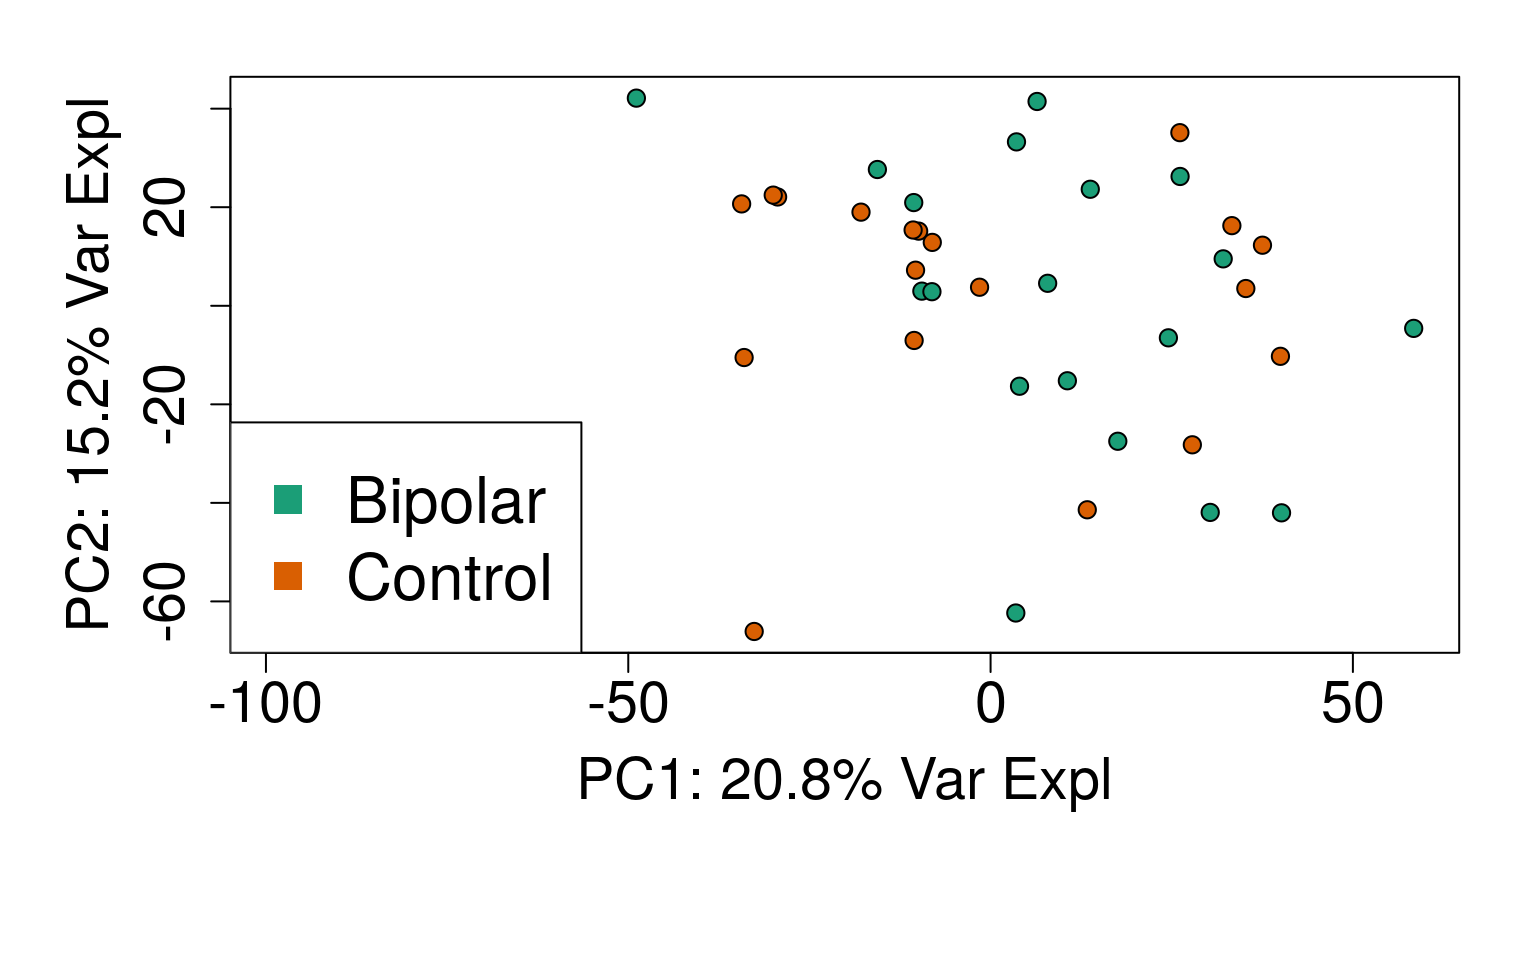
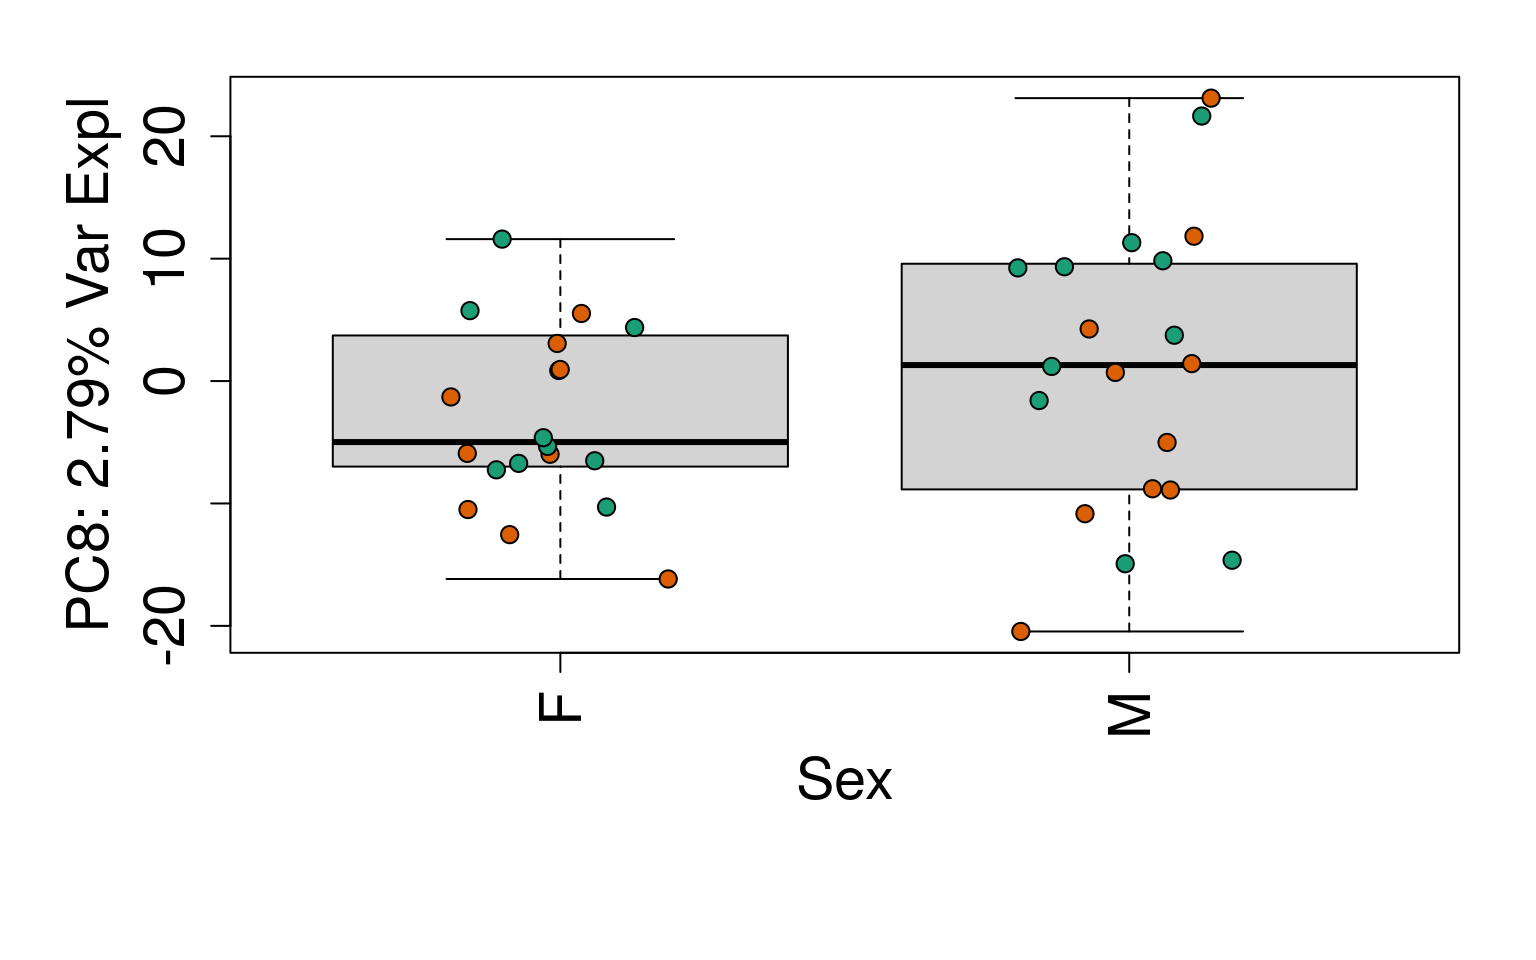
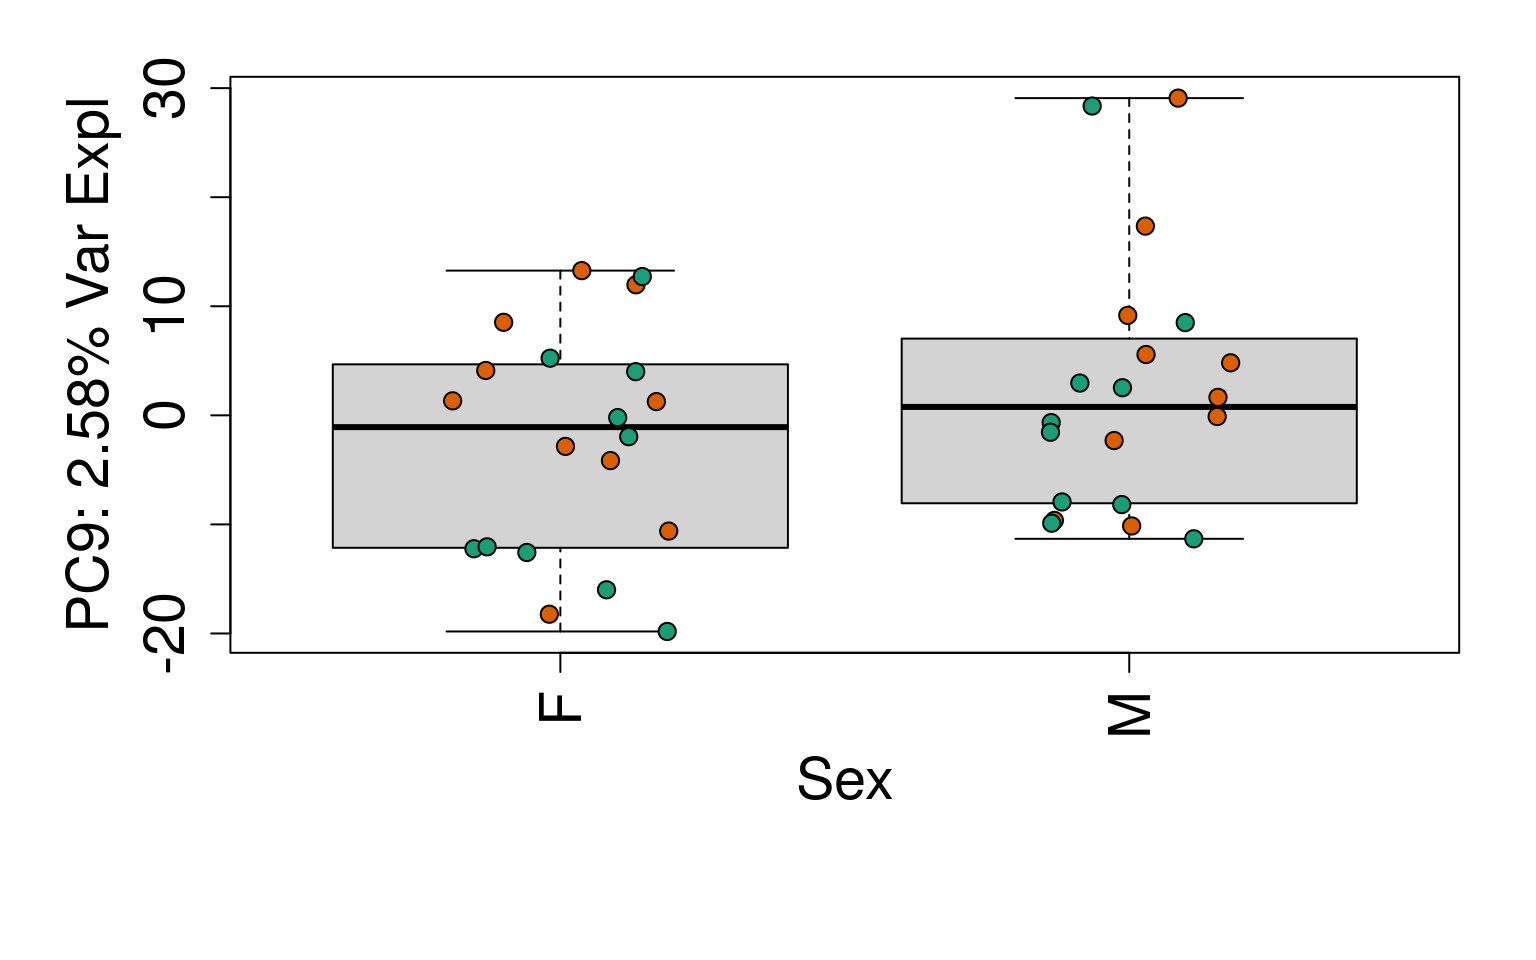
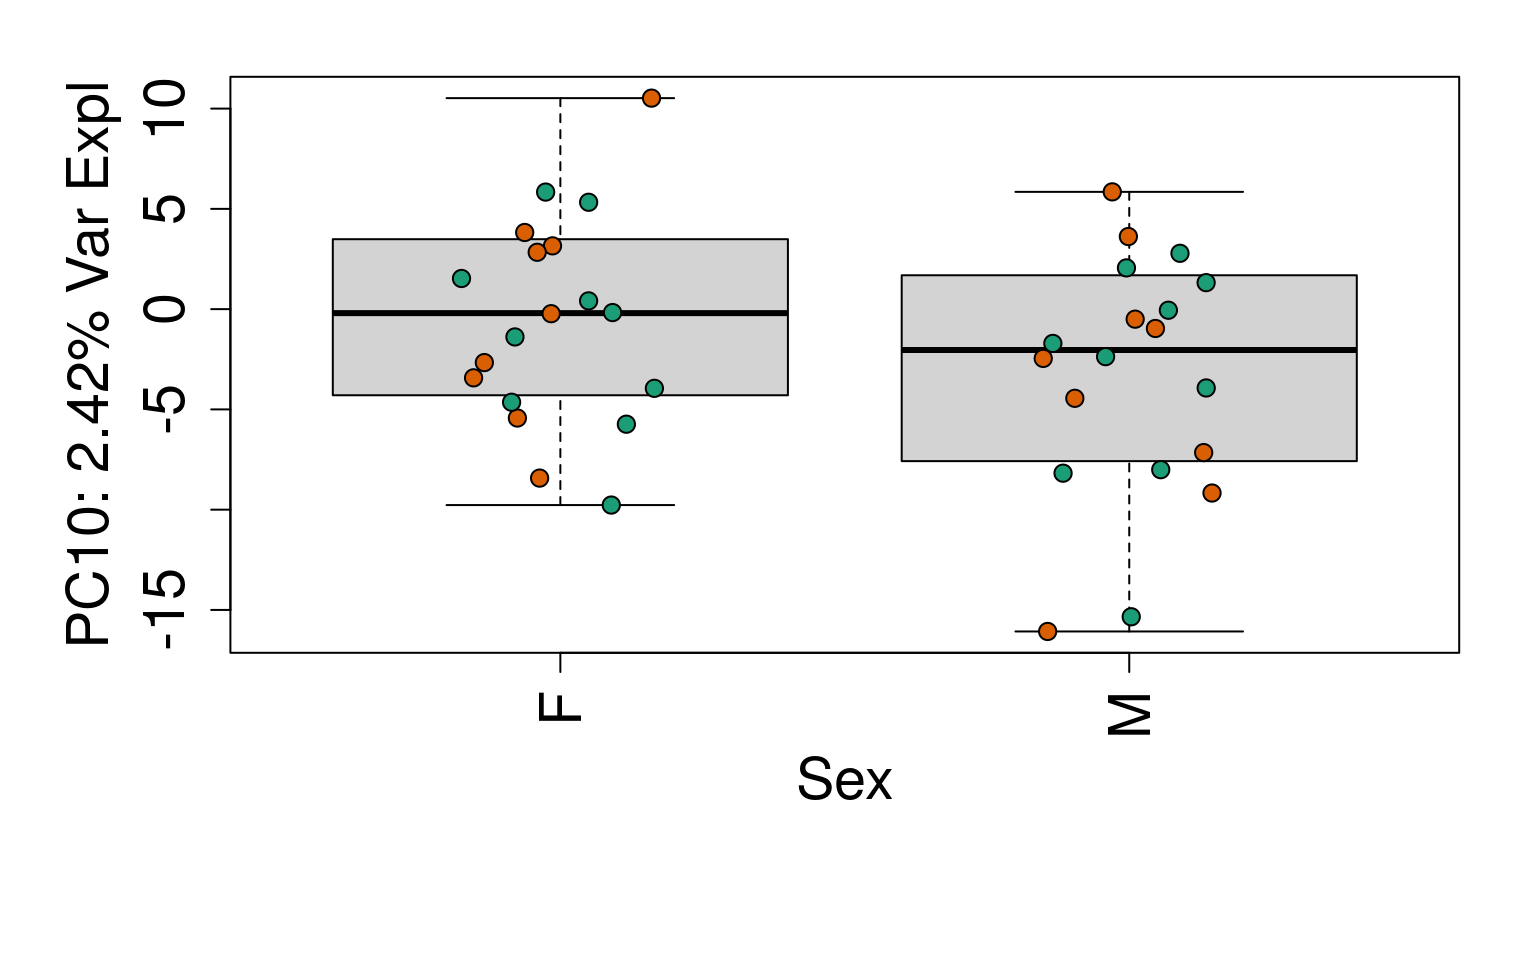
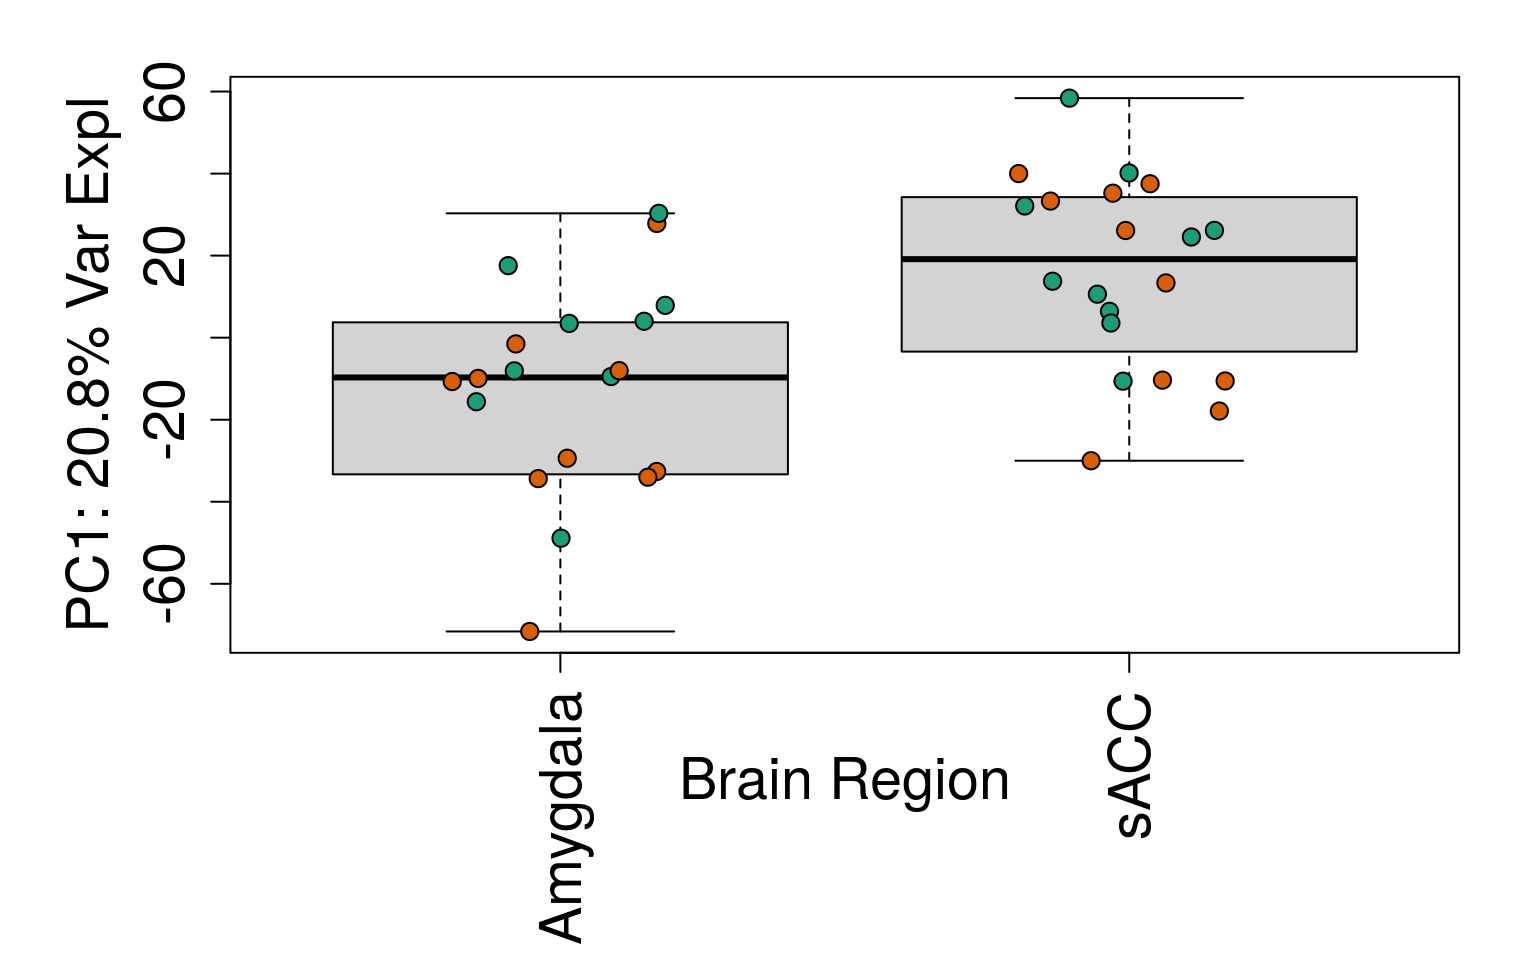
# Write plots to PDF
pdf(here("DE_analysis", "pdfs", "PCA_plotsExprs.pdf"), width = 9)
set.seed(20201006)
generate_plots()
dev.off()
## png
## 21.6 Modeling
dge <- DGEList(
    counts = assays(rse_gene)$counts,
    genes = rowData(rse_gene)
)
dge <- calcNormFactors(dge)

# Mean-variance
mod <- model.matrix(~ PrimaryDx + PC + BrainRegion,
    data = colData(rse_gene)
)

vGene <- invisible(voom(dge, mod, plot = TRUE))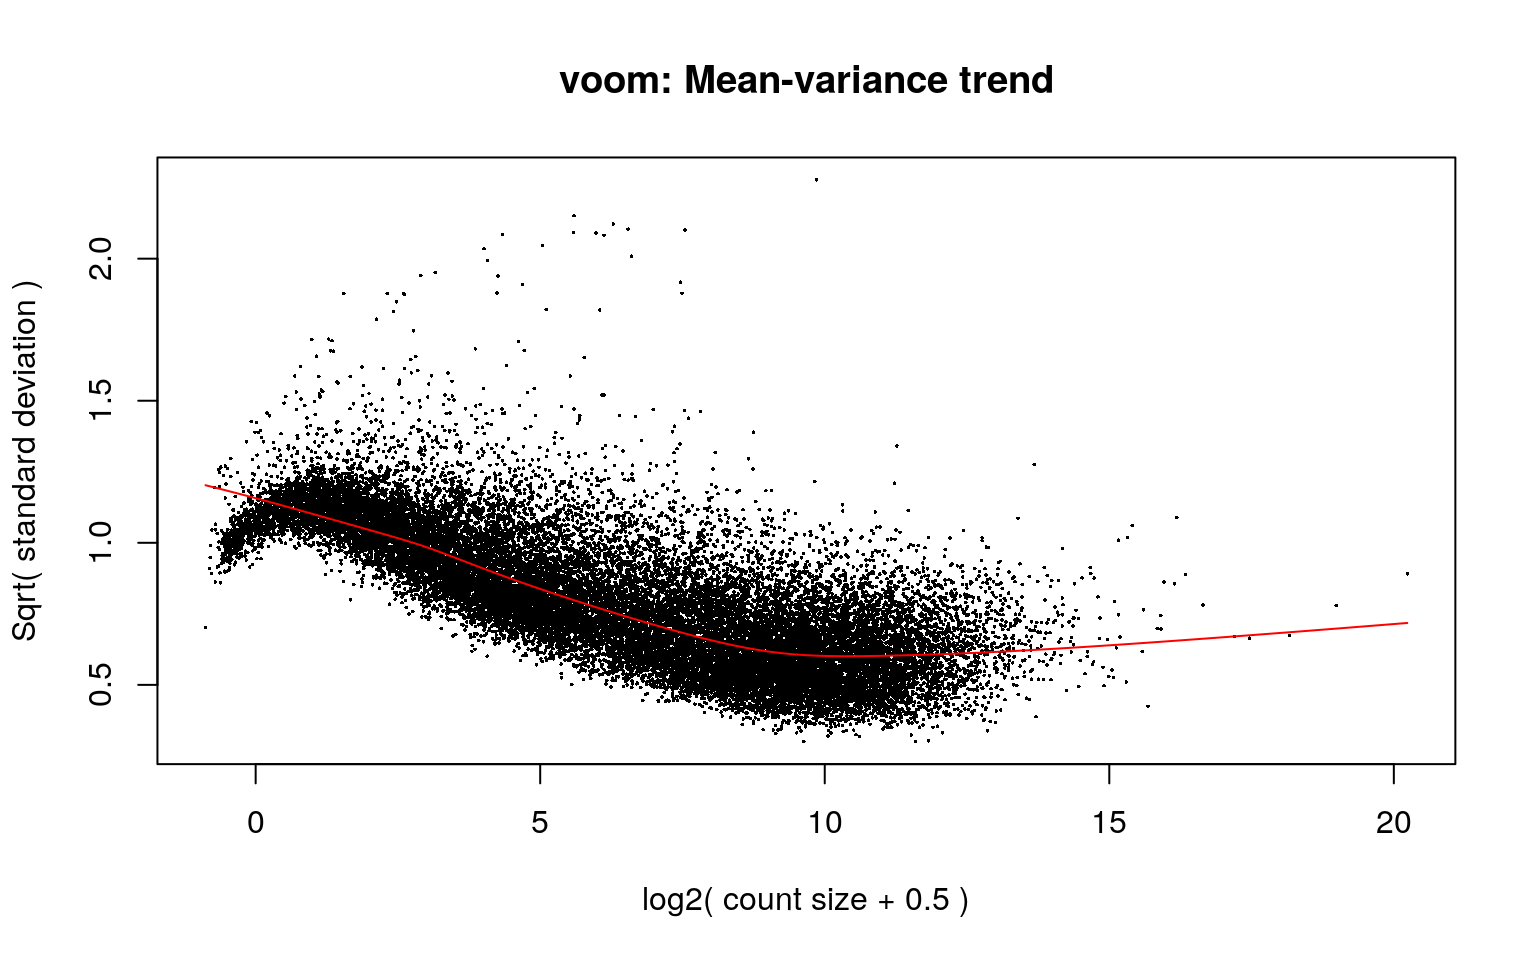
# Also write mean-variance plot to PDF
pdf(file = here("DE_analysis", "pdfs", "vGene.pdf"))
invisible(voom(dge, mod, plot = TRUE))
dev.off()
## png
## 2# Get duplicate correlation
gene_dupCorr <- duplicateCorrelation(vGene$E, mod,
block = colData(rse_gene)$BrNum
)
gene_dupCorr$consensus.correlation## [1] 0.5626941## We can save this for later since it can take a while
## to compute and we might need it. This will be useful
## for larger projects.
save(gene_dupCorr,
file = here("DE_analysis", "rdas", "gene_dupCorr_neurons.rda")
)
# Fit linear model
fitGeneDupl <- lmFit(
vGene,
correlation = gene_dupCorr$consensus.correlation,
block = colData(rse_gene)$BrNum
)
# Here we perform an empirical Bayesian calculation to obtain our significant genes
ebGeneDupl <- eBayes(fitGeneDupl)
outGeneDupl <- topTable(
ebGeneDupl,
coef = 2,
p.value = 1,
number = nrow(rse_gene),
sort.by = "none"
)
pdf(file = here("DE_analysis", "pdfs", "hist_pval.pdf"))
hist(outGeneDupl$P.Value)
dev.off()## png
## 2hist(outGeneDupl$P.Value)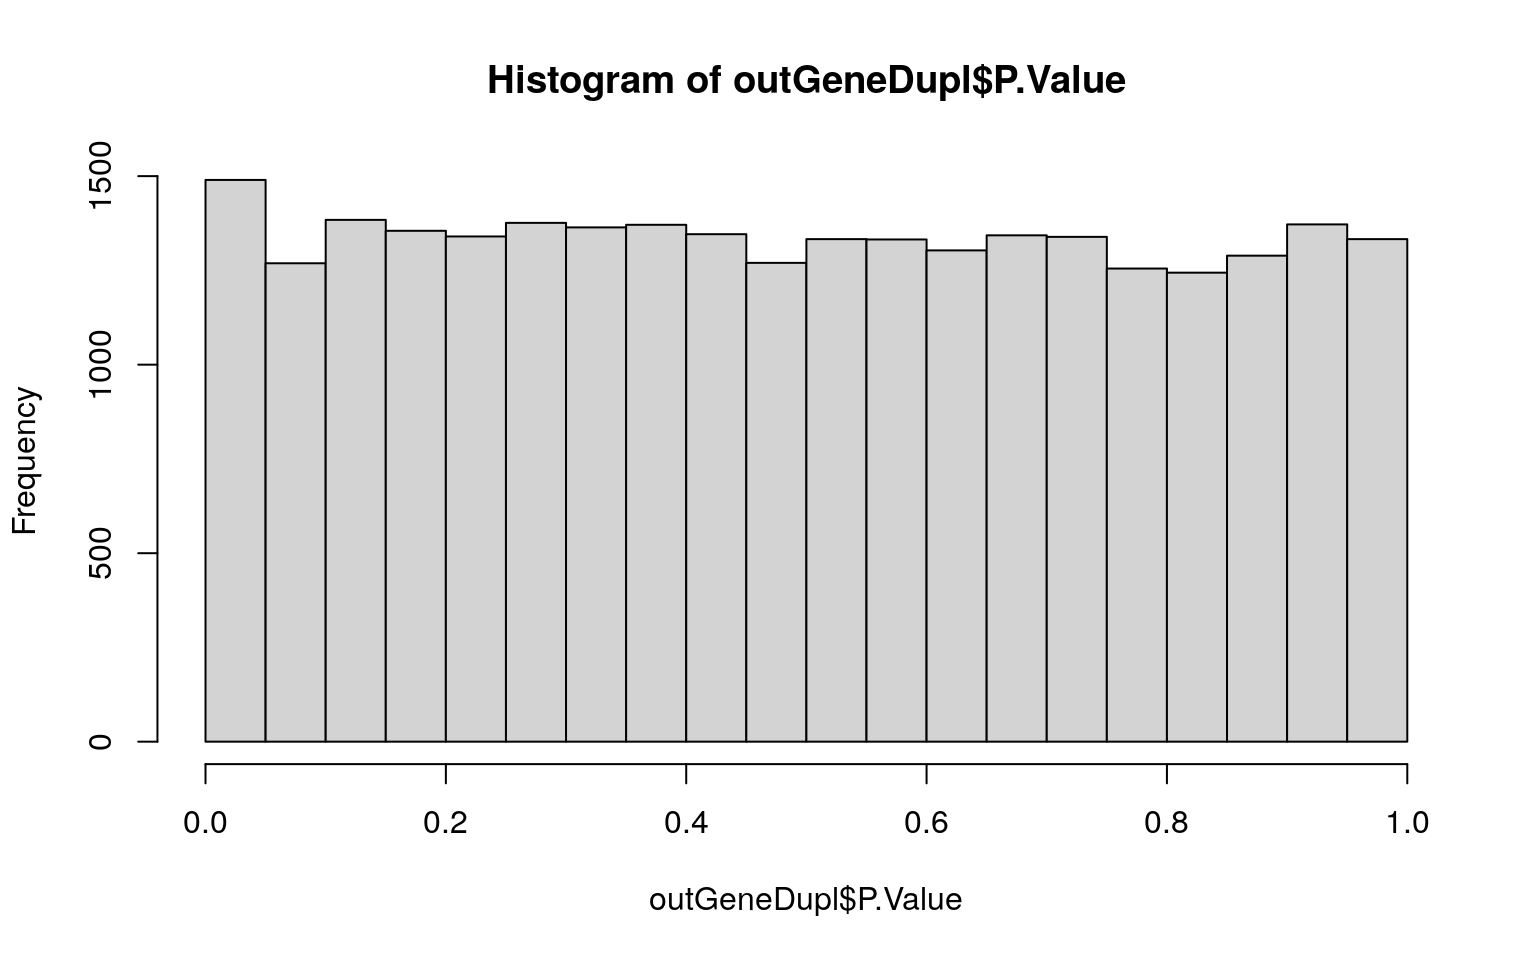
table(outGeneDupl$adj.P.Val < 0.05)##
## FALSE
## 26708table(outGeneDupl$adj.P.Val < 0.1)##
## FALSE TRUE
## 26707 1sigGeneDupl <- topTable(
ebGeneDupl,
coef = 2,
p.value = 0.2,
number = nrow(rse_gene)
)
sigGeneDupl[, c("Symbol", "logFC", "P.Value", "AveExpr")]## Symbol logFC P.Value AveExpr
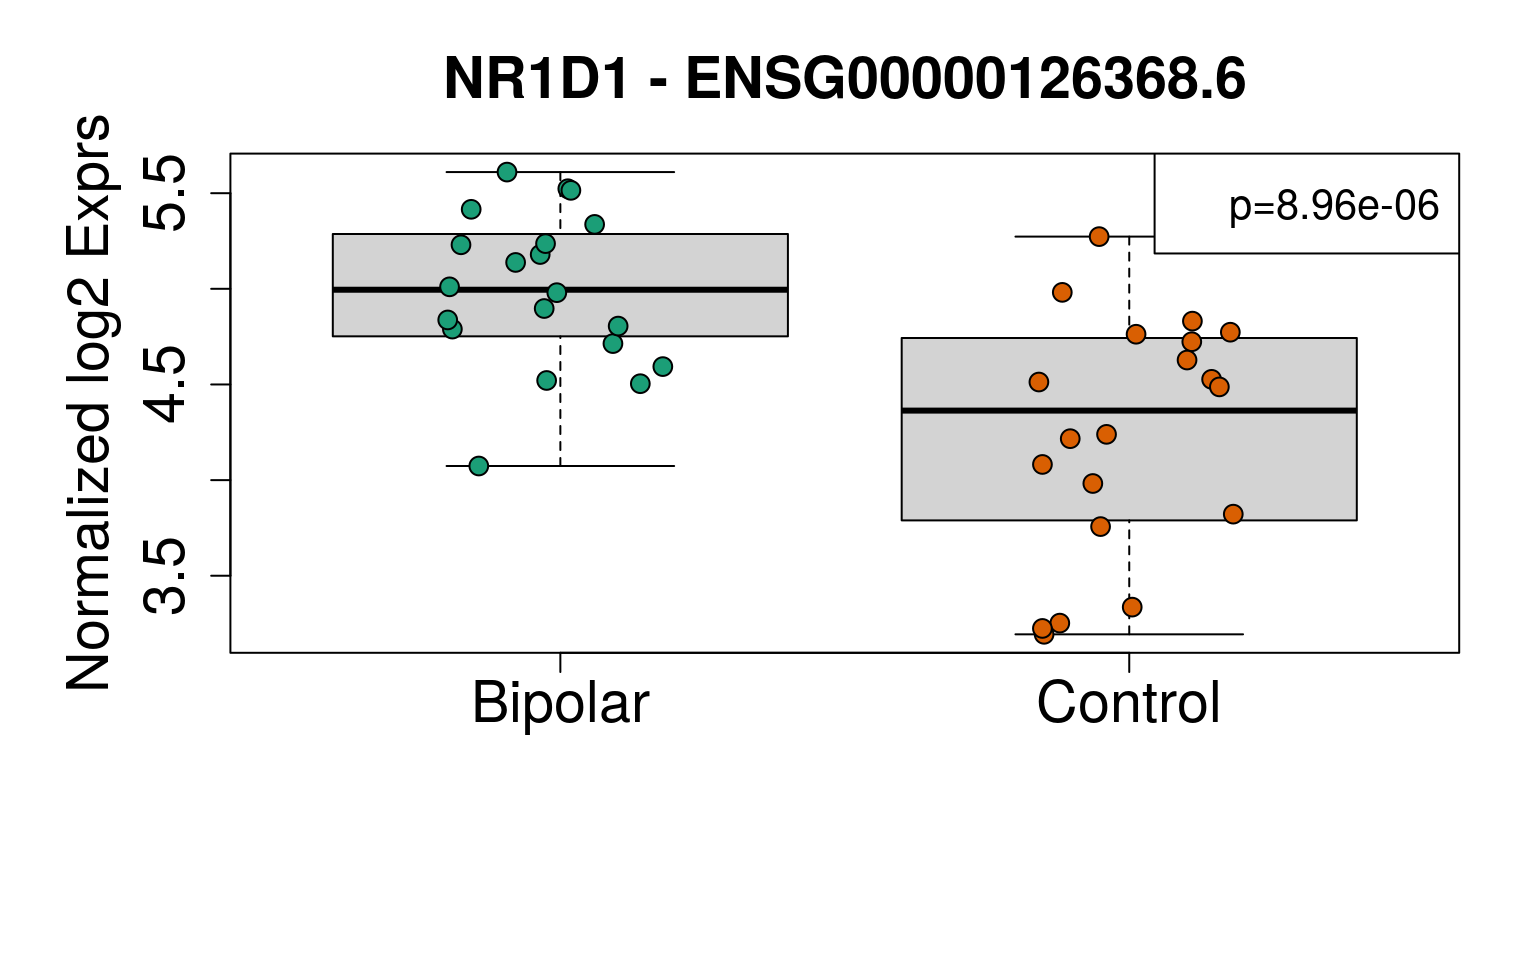
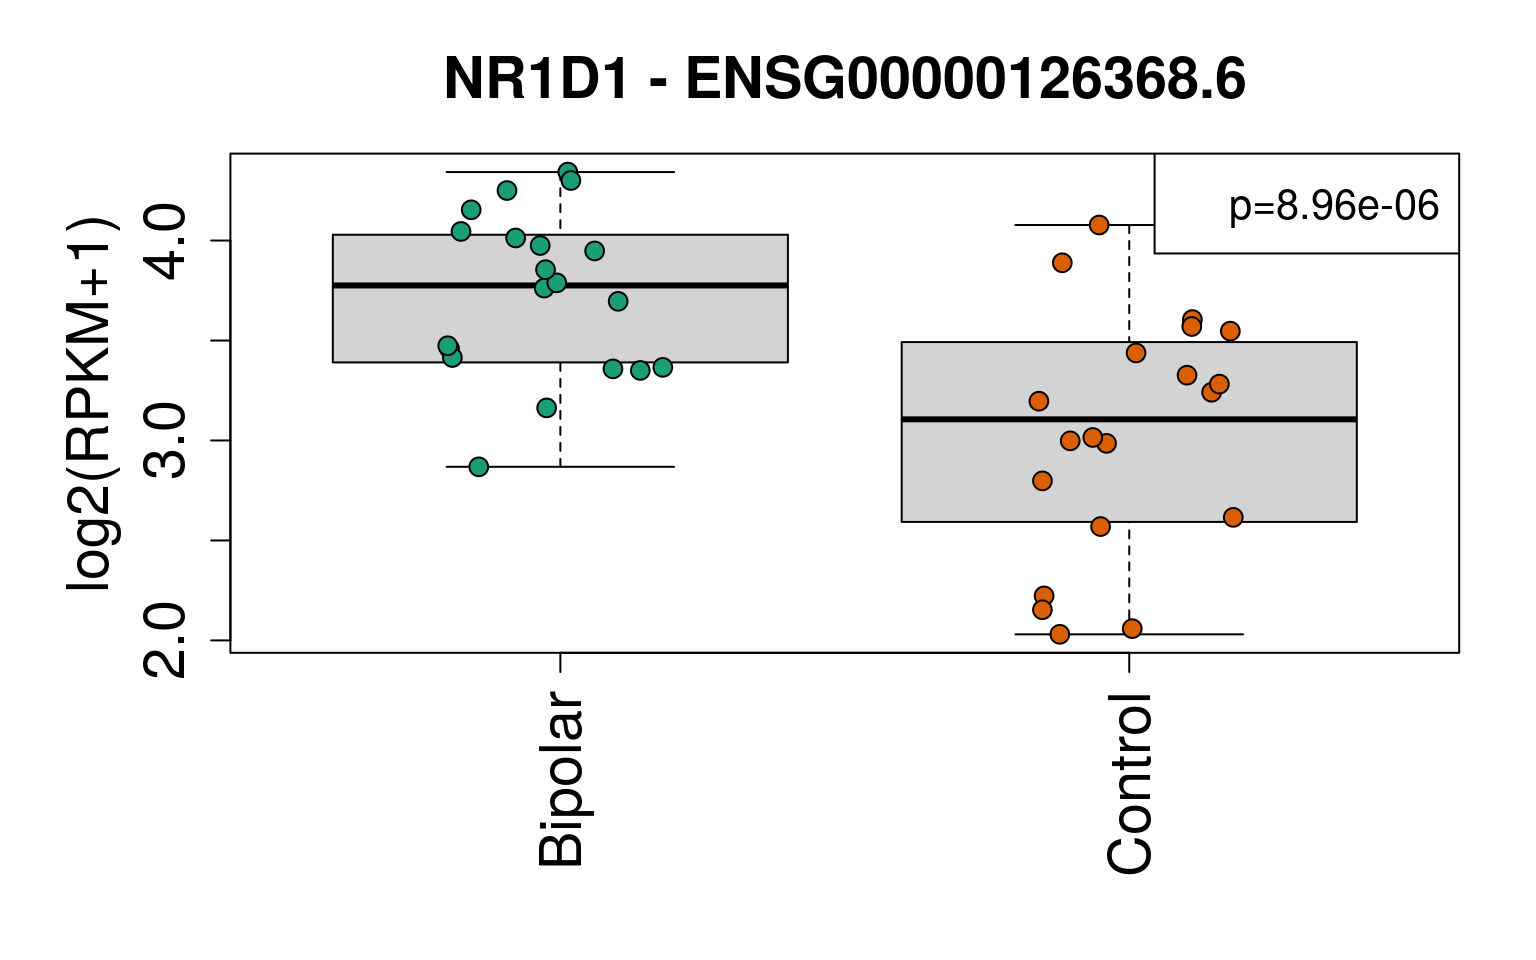
## ENSG00000269699.6 ZIM2 -1.0860109 2.073084e-06 0.8970203
## ENSG00000126368.6 NR1D1 -0.7676477 8.956110e-06 4.6128957sigGeneDupl[sigGeneDupl$logFC > 0, c("Symbol", "logFC", "P.Value")]## [1] Symbol logFC P.Value
## <0 rows> (or 0-length row.names)sigGeneDupl[sigGeneDupl$logFC < 0, c("Symbol", "logFC", "P.Value")]## Symbol logFC P.Value
## ENSG00000269699.6 ZIM2 -1.0860109 2.073084e-06
## ENSG00000126368.6 NR1D1 -0.7676477 8.956110e-06write.csv(outGeneDupl,
file = here("DE_analysis", "tables", "de_stats_allExprs.csv")
)
write.csv(sigGeneDupl,
file = here("DE_analysis", "tables", "de_stats_fdr20_sorted.csv")
)1.7 Check plots
exprs <- vGene$E[rownames(sigGeneDupl), ]

# Group together code for displaying boxplots
generate_plots <- function() {
    par(
        mar = c(8, 6, 4, 2),
        cex.axis = 1.8,
        cex.lab = 1.8,
        cex.main = 1.8
    )
    palette(brewer.pal(4, "Dark2"))

    for (i in 1:nrow(sigGeneDupl)) {
        yy <- exprs[i, ]
        boxplot(
            yy ~ rse_gene$PrimaryDx,
            outline = FALSE,
            ylim = range(yy),
            ylab = "Normalized log2 Exprs",
            xlab = "",
            main = paste(sigGeneDupl$Symbol[i], "-", sigGeneDupl$gencodeID[i])
        )
        points(
            yy ~ jitter(as.numeric(rse_gene$PrimaryDx)),
            pch = 21,
            bg = rse_gene$PrimaryDx,
            cex = 1.3
        )
        ll <-
            ifelse(sigGeneDupl$logFC[i] > 0, "topleft", "topright")
        legend(ll, paste0("p=", signif(sigGeneDupl$P.Value[i], 3)), cex = 1.3)
    }
}

# Show boxplots
set.seed(20201006)
generate_plots()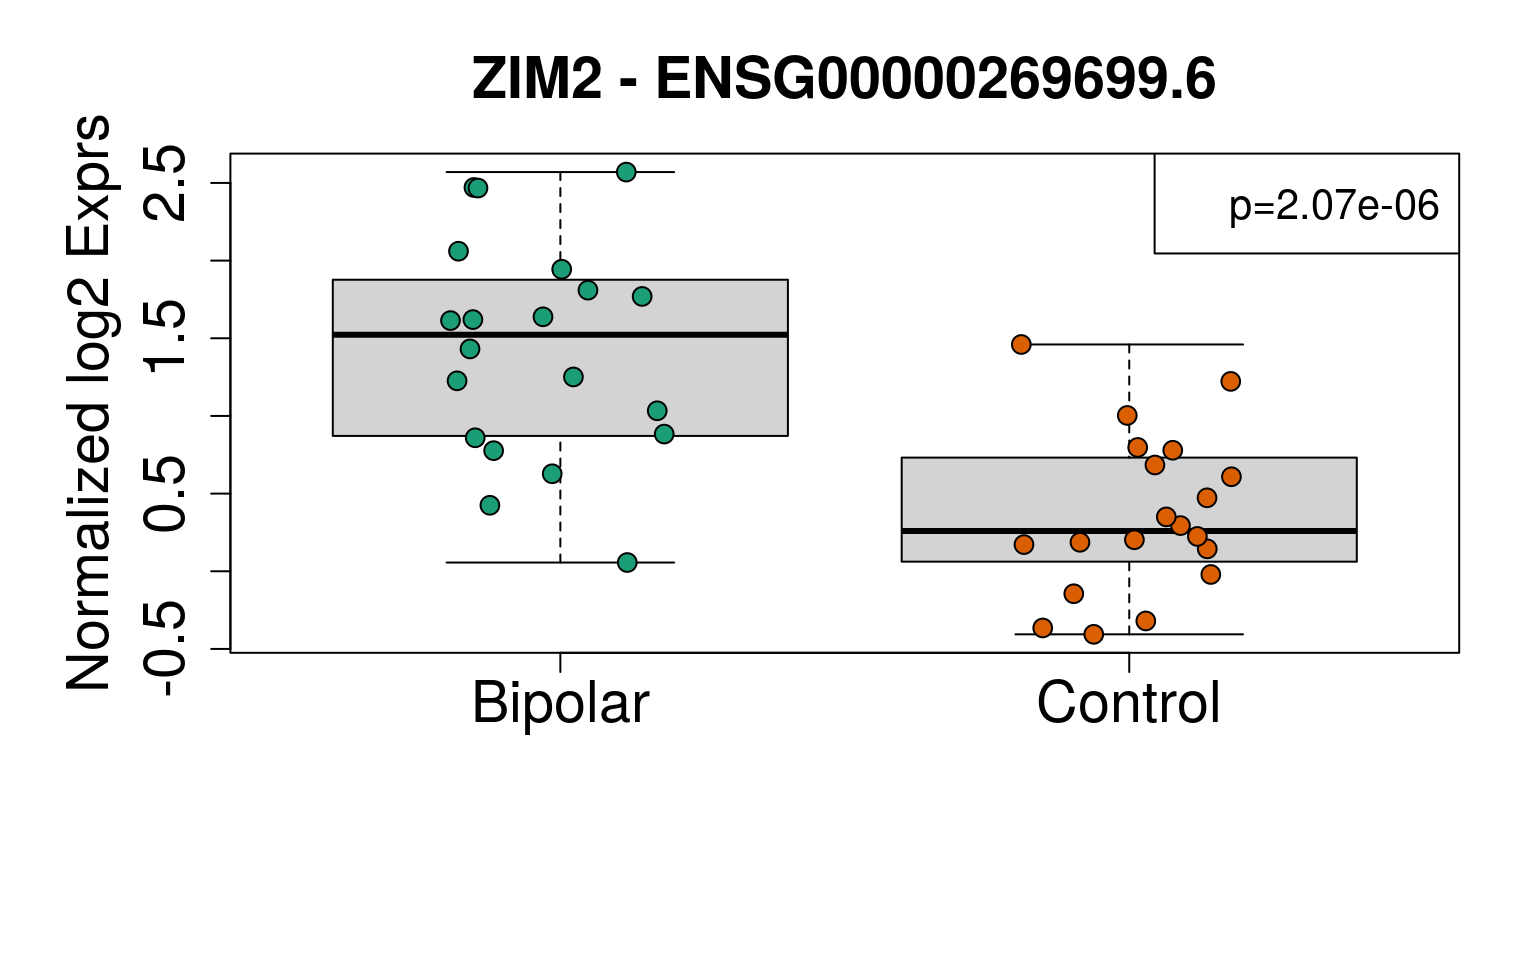
# Write plots to PDF
pdf(here("DE_analysis", "pdfs", "DE_boxplots_byDiagnosis.pdf"),
    width = 10
)
set.seed(20201006)
generate_plots()
dev.off()
## png
## 2e <- geneExprs[rownames(sigGeneDupl), ]
generate_plots <- function() {
par(
mar = c(8, 6, 4, 2),
cex.axis = 1.8,
cex.lab = 1.8,
cex.main = 1.8
)
palette(brewer.pal(4, "Dark2"))
for (i in 1:nrow(sigGeneDupl)) {
yy <- e[i, ]
boxplot(
yy ~ rse_gene$PrimaryDx,
las = 3,
outline = FALSE,
ylim = range(yy),
ylab = "log2(RPKM+1)",
xlab = "",
main = paste(sigGeneDupl$Symbol[i], "-", sigGeneDupl$gencodeID[i])
)
points(
yy ~ jitter(as.numeric(rse_gene$PrimaryDx)),
pch = 21,
bg = rse_gene$PrimaryDx,
cex = 1.3
)
ll <-
ifelse(sigGeneDupl$logFC[i] > 0, "topleft", "topright")
legend(ll, paste0("p=", signif(sigGeneDupl$P.Value[i], 3)), cex = 1.3)
}
}
# Display plots
set.seed(20201006)
generate_plots()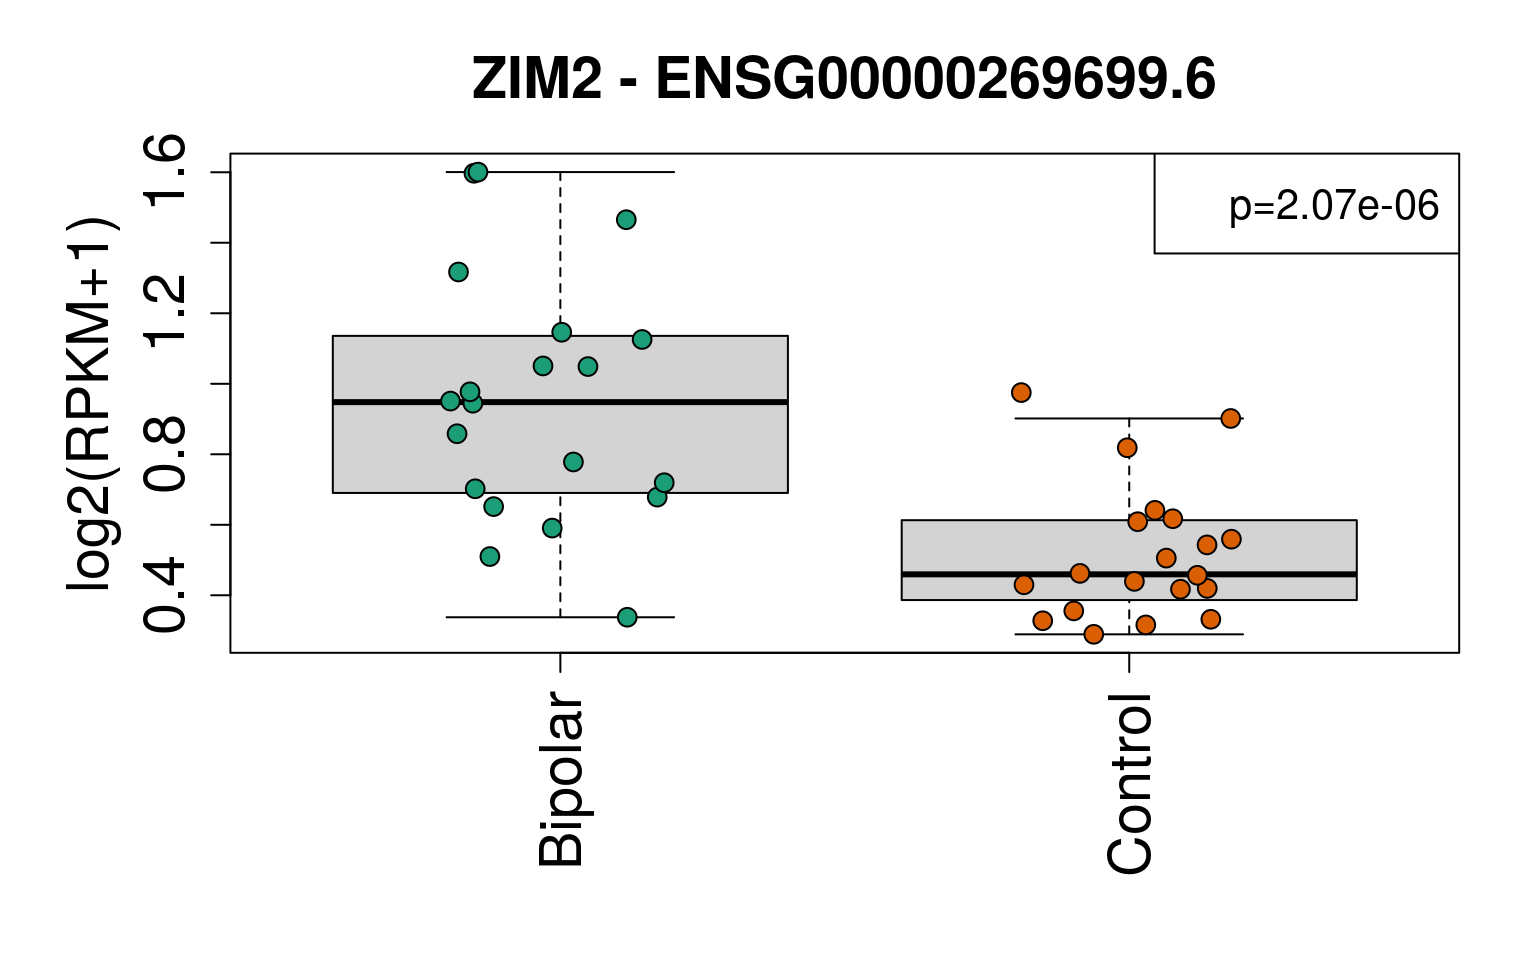
# Write the same plots to PDF
pdf(here("DE_analysis", "pdfs", "DE_boxplots_byGenome_log2RPKM.pdf"),
    w = 10
)
set.seed(20201006)
generate_plots()
dev.off()
## png
## 21.8 Gene ontology
clusterProfiler is a gene ontology package we will use to see if our genes are specifically differentially expressed in certain pathways.
# Get significant genes by sign
sigGene <- outGeneDupl[outGeneDupl$P.Value < 0.005, ]
sigGeneList <-
    split(as.character(sigGene$EntrezID), sign(sigGene$logFC))
sigGeneList <- lapply(sigGeneList, function(x) {
      x[!is.na(x)]
  })
geneUniverse <- as.character(outGeneDupl$EntrezID)
geneUniverse <- geneUniverse[!is.na(geneUniverse)]

# Do GO
goBP_Adj <- compareCluster(
    sigGeneList,
    fun = "enrichGO",
    universe = geneUniverse,
    OrgDb = org.Hs.eg.db,
    ont = "BP",
    pAdjustMethod = "BH",
    pvalueCutoff = 1,
    qvalueCutoff = 1,
    readable = TRUE
)

goMF_Adj <- compareCluster(
    sigGeneList,
    fun = "enrichGO",
    universe = geneUniverse,
    OrgDb = org.Hs.eg.db,
    ont = "MF",
    pAdjustMethod = "BH",
    pvalueCutoff = 1,
    qvalueCutoff = 1,
    readable = TRUE
)

goCC_Adj <- compareCluster(
    sigGeneList,
    fun = "enrichGO",
    universe = geneUniverse,
    OrgDb = org.Hs.eg.db,
    ont = "CC",
    pAdjustMethod = "BH",
    pvalueCutoff = 1,
    qvalueCutoff = 1,
    readable = TRUE
)

save(
    goBP_Adj,
    goCC_Adj,
    goMF_Adj,
    file = here("DE_analysis", "rdas", "gene_set_objects_p005.rda")
)

goList <-
    list(
        BP = goBP_Adj,
        MF = goMF_Adj,
        CC = goCC_Adj
    )
goDf <-
    dplyr::bind_rows(lapply(goList, as.data.frame), .id = "Ontology")
goDf <- goDf[order(goDf$pvalue), ]

write.csv(
    goDf,
    file = here("DE_analysis", "tables", "geneSet_output.csv"),
    row.names = FALSE
)

options(width = 130)
goDf[goDf$p.adjust < 0.05, c(1:5, 7)]
## Ontology Cluster ID Description GeneRatio pvalue
## 696 BP 1 GO:0032611 interleukin-1 beta production 6/73 2.152775e-06
## 697 BP 1 GO:0050865 regulation of cell activation 12/73 2.709506e-06
## 698 BP 1 GO:0032612 interleukin-1 production 6/73 3.747905e-06
## 699 BP 1 GO:0002694 regulation of leukocyte activation 11/73 7.875320e-06
## 700 BP 1 GO:0002521 leukocyte differentiation 11/73 8.260455e-06
## 701 BP 1 GO:1903977 positive regulation of glial cell migration 3/73 1.751400e-05
## 702 BP 1 GO:0032651 regulation of interleukin-1 beta production 5/73 2.175911e-05
## 703 BP 1 GO:0002687 positive regulation of leukocyte migration 6/73 2.728969e-05
## 704 BP 1 GO:0032652 regulation of interleukin-1 production 5/73 3.392997e-05
## 2505 MF 1 GO:0046935 1-phosphatidylinositol-3-kinase regulator activity 3/78 3.586132e-05
## 2403 MF -1 GO:0070888 E-box binding 3/27 5.240514e-05
## 705 BP 1 GO:0042116 macrophage activation 5/73 5.417072e-05
## 706 BP 1 GO:1903975 regulation of glial cell migration 3/73 6.513291e-05
## 707 BP 1 GO:0009617 response to bacterium 10/73 6.787695e-05
## 708 BP 1 GO:0050867 positive regulation of cell activation 8/73 7.145608e-05
## 709 BP 1 GO:0060216 definitive hemopoiesis 3/73 7.985372e-05
## 2506 MF 1 GO:0035014 phosphatidylinositol 3-kinase regulator activity 3/78 8.982040e-05
## 710 BP 1 GO:0071346 cellular response to interferon-gamma 6/73 9.340196e-05
## 711 BP 1 GO:0032640 tumor necrosis factor production 5/73 1.034823e-04
## 712 BP 1 GO:0071706 tumor necrosis factor superfamily cytokine production 5/73 1.152814e-04
## 713 BP 1 GO:0043032 positive regulation of macrophage activation 3/73 1.154607e-04
## 714 BP 1 GO:0006911 phagocytosis, engulfment 4/73 1.159941e-04
## 715 BP 1 GO:0034341 response to interferon-gamma 6/73 1.594765e-04
## 716 BP 1 GO:0032691 negative regulation of interleukin-1 beta production 3/73 1.600617e-04
## 717 BP 1 GO:0050901 leukocyte tethering or rolling 3/73 1.600617e-04
## 718 BP 1 GO:0032692 negative regulation of interleukin-1 production 3/73 1.860176e-04
## 719 BP 1 GO:0071219 cellular response to molecule of bacterial origin 6/73 1.904654e-04
## 720 BP 1 GO:0099024 plasma membrane invagination 4/73 2.147043e-04
## 721 BP 1 GO:0006909 phagocytosis 7/73 2.268305e-04
## 722 BP 1 GO:0002685 regulation of leukocyte migration 6/73 2.416443e-04
## 2788 CC 1 GO:0005942 phosphatidylinositol 3-kinase complex 3/78 2.628695e-04
## 723 BP 1 GO:1905523 positive regulation of macrophage migration 3/73 3.167471e-04
## 2404 MF -1 GO:0001222 transcription corepressor binding 2/27 3.247270e-04
## 724 BP 1 GO:0002696 positive regulation of leukocyte activation 7/73 3.592269e-04
## 725 BP 1 GO:0010324 membrane invagination 4/73 3.630130e-04
## 726 BP 1 GO:0050900 leukocyte migration 8/73 3.775535e-04
## 727 BP 1 GO:0071216 cellular response to biotic stimulus 6/73 3.994430e-04
## 728 BP 1 GO:0030851 granulocyte differentiation 3/73 3.997182e-04
## 729 BP 1 GO:0002683 negative regulation of immune system process 8/73 4.699007e-04
## 730 BP 1 GO:0007599 hemostasis 7/73 5.354016e-04
## 731 BP 1 GO:0042742 defense response to bacterium 5/73 6.027506e-04
## 732 BP 1 GO:0032609 interferon-gamma production 4/73 6.045120e-04
## 733 BP 1 GO:0030335 positive regulation of cell migration 9/73 6.264150e-04
## 734 BP 1 GO:0061756 leukocyte adhesion to vascular endothelial cell 3/73 7.285188e-04
## 735 BP 1 GO:0002275 myeloid cell activation involved in immune response 9/73 7.690347e-04
## 736 BP 1 GO:2000147 positive regulation of cell motility 9/73 7.690347e-04
## 737 BP 1 GO:0008217 regulation of blood pressure 5/73 9.068831e-04
## 738 BP 1 GO:0040017 positive regulation of locomotion 9/73 9.232911e-04
## 739 BP 1 GO:0045766 positive regulation of angiogenesis 5/73 9.365722e-04
## 740 BP 1 GO:0001774 microglial cell activation 3/73 9.424071e-04
## 741 BP 1 GO:0002269 leukocyte activation involved in inflammatory response 3/73 9.424071e-04
## 742 BP 1 GO:0051272 positive regulation of cellular component movement 9/73 9.655575e-04
## 743 BP 1 GO:0032680 regulation of tumor necrosis factor production 4/73 9.869644e-04
## 744 BP 1 GO:0033003 regulation of mast cell activation 3/73 1.021614e-03
## 745 BP 1 GO:1905521 regulation of macrophage migration 3/73 1.021614e-03
## 746 BP 1 GO:0048863 stem cell differentiation 6/73 1.070488e-03
## 747 BP 1 GO:1902105 regulation of leukocyte differentiation 6/73 1.070488e-03
## 748 BP 1 GO:1903555 regulation of tumor necrosis factor superfamily cytokine production 4/73 1.080011e-03
## 749 BP 1 GO:0043300 regulation of leukocyte degranulation 3/73 1.192384e-03
## 750 BP 1 GO:0002703 regulation of leukocyte mediated immunity 5/73 1.237410e-03
## 751 BP 1 GO:0071222 cellular response to lipopolysaccharide 5/73 1.237410e-03
## 752 BP 1 GO:0035589 G protein-coupled purinergic nucleotide receptor signaling pathway 2/73 1.252424e-03
## 753 BP 1 GO:0043373 CD4-positive, alpha-beta T cell lineage commitment 2/73 1.252424e-03
## 754 BP 1 GO:0150078 positive regulation of neuroinflammatory response 2/73 1.252424e-03
## 755 BP 1 GO:0003018 vascular process in circulatory system 5/73 1.274776e-03
## 756 BP 1 GO:0043030 regulation of macrophage activation 3/73 1.480606e-03
## 757 BP 1 GO:0033004 negative regulation of mast cell activation 2/73 1.525410e-03
## 758 BP 1 GO:0098883 synapse pruning 2/73 1.525410e-03
## 759 BP 1 GO:1904018 positive regulation of vasculature development 5/73 1.604501e-03
## 760 BP 1 GO:0043270 positive regulation of ion transport 6/73 1.612708e-03
## 761 BP 1 GO:0032729 positive regulation of interferon-gamma production 3/73 1.695010e-03
## 762 BP 1 GO:0061900 glial cell activation 3/73 1.695010e-03
## 763 BP 1 GO:1903708 positive regulation of hemopoiesis 5/73 1.791082e-03
## 764 BP 1 GO:0070098 chemokine-mediated signaling pathway 3/73 1.809105e-03
## 765 BP 1 GO:0002363 alpha-beta T cell lineage commitment 2/73 1.824120e-03
## 766 BP 1 GO:0060100 positive regulation of phagocytosis, engulfment 2/73 1.824120e-03
## 767 BP 1 GO:1905155 positive regulation of membrane invagination 2/73 1.824120e-03
## 768 BP 1 GO:0002761 regulation of myeloid leukocyte differentiation 4/73 1.840134e-03
## 769 BP 1 GO:0032496 response to lipopolysaccharide 6/73 1.911828e-03
## 770 BP 1 GO:1905517 macrophage migration 3/73 1.927887e-03
## 771 BP 1 GO:0010959 regulation of metal ion transport 7/73 1.959092e-03
## 772 BP 1 GO:0002886 regulation of myeloid leukocyte mediated immunity 3/73 2.051425e-03
## 773 BP 1 GO:0043551 regulation of phosphatidylinositol 3-kinase activity 3/73 2.051425e-03
## 774 BP 1 GO:0001819 positive regulation of cytokine production 7/73 2.061951e-03
## 775 BP 1 GO:0043369 CD4-positive or CD8-positive, alpha-beta T cell lineage commitment 2/73 2.148276e-03
## 776 BP 1 GO:0060099 regulation of phagocytosis, engulfment 2/73 2.148276e-03
## 777 BP 1 GO:0002573 myeloid leukocyte differentiation 5/73 2.211391e-03
## 778 BP 1 GO:0045765 regulation of angiogenesis 6/73 2.251326e-03
## 779 BP 1 GO:0043410 positive regulation of MAPK cascade 8/73 2.320852e-03
## 780 BP 1 GO:0050729 positive regulation of inflammatory response 4/73 2.373979e-03
## 781 BP 1 GO:0002237 response to molecule of bacterial origin 6/73 2.437266e-03
## 782 BP 1 GO:0001562 response to protozoan 2/73 2.497604e-03
## 783 BP 1 GO:0042832 defense response to protozoan 2/73 2.497604e-03
## 784 BP 1 GO:1903978 regulation of microglial cell activation 2/73 2.497604e-03
## 785 BP 1 GO:1905153 regulation of membrane invagination 2/73 2.497604e-03
## 786 BP 1 GO:0030098 lymphocyte differentiation 6/73 2.584154e-03
## 787 BP 1 GO:0008347 glial cell migration 3/73 2.594437e-03
## 788 BP 1 GO:0031663 lipopolysaccharide-mediated signaling pathway 3/73 2.594437e-03
## 789 BP 1 GO:0045576 mast cell activation 3/73 2.594437e-03
## 790 BP 1 GO:0050766 positive regulation of phagocytosis 3/73 2.594437e-03
## 791 BP 1 GO:0032635 interleukin-6 production 4/73 2.722582e-03
## 792 BP 1 GO:0007596 blood coagulation 6/73 2.737616e-03
## 793 BP 1 GO:0007159 leukocyte cell-cell adhesion 6/73 2.843668e-03
## 794 BP 1 GO:0050817 coagulation 6/73 2.843668e-03
## 795 BP 1 GO:0043900 regulation of multi-organism process 3/73 2.896130e-03
## 796 BP 1 GO:1990868 response to chemokine 3/73 2.896130e-03
## 797 BP 1 GO:1990869 cellular response to chemokine 3/73 2.896130e-03
## 798 BP 1 GO:0071695 anatomical structure maturation 5/73 2.901368e-031.9 Visualize differentially expressed genes
Here we visualize DEGs with a heatmap.
exprs_heatmap <- vGene$E[rownames(sigGene), ]

df <- as.data.frame(colData(rse_gene)[, c("PrimaryDx", "Sex", "BrainRegion")])
rownames(df) <- colnames(exprs_heatmap) <- gsub("_.*", "", colnames(exprs_heatmap))
colnames(df) <- c("Diagnosis", "Sex", "Region")

#  Manually determine coloring for plot annotation
palette_names = c('Dark2', 'Paired', 'YlOrRd')
ann_colors = list()
for (i in 1:ncol(df)) {
    col_name = colnames(df)[i]
    n_uniq_colors = length(unique(df[,col_name]))

    #   Use a unique palette with the correct number of levels, named with
    #   those levels
    ann_colors[[col_name]] = RColorBrewer::brewer.pal(n_uniq_colors, palette_names[i])[1:n_uniq_colors]
    names(ann_colors[[col_name]]) = unique(df[,col_name])
}
## Warning in RColorBrewer::brewer.pal(n_uniq_colors, palette_names[i]): minimal value for n is 3, returning requested palette with 3 different levels
## Warning in RColorBrewer::brewer.pal(n_uniq_colors, palette_names[i]): minimal value for n is 3, returning requested palette with 3 different levels
## Warning in RColorBrewer::brewer.pal(n_uniq_colors, palette_names[i]): minimal value for n is 3, returning requested palette with 3 different levels# Display heatmap
pheatmap(
exprs_heatmap,
cluster_rows = TRUE,
show_rownames = FALSE,
cluster_cols = TRUE,
annotation_col = df,
annotation_colors = ann_colors
)
2 Reproducibility
This analysis report was made possible thanks to:
- R (Kolde, 2019)
- BiocStyle (R Core Team, 2020)
- clusterProfiler (Allaire, Xie, McPherson, Luraschi et al., 2020)
- devtools (Boettiger, 2021)
- edgeR
- here (Collado-Torres, Nellore, Kammers, Ellis et al., 2017)
- jaffelab (Collado-Torres, Nellore, Kammers, Ellis et al., 2024)
- limma (Ellis, Collado-Torres, Jaffe, and Leek, 2018)
- knitcitations (Collado-Torres, Jaffe, and Burke, 2024)
- org.Hs.eg.db (Frazee, Langmead, and Leek, 2011)
- pheatmap (Imada, Sanchez, Collado-Torres, Wilks et al., 2020)
- RColorBrewer (McCarthy, Chen, and Smyth, 2012)
- recount
- rmarkdown
- SummarizedExperiment (Xie, Dervieux, and Riederer, 2020)
- voom (Yu, Wang, Han, and He, 2012)
[1] J. Allaire, Y. Xie, J. McPherson, J. Luraschi, et al. rmarkdown: Dynamic Documents for R. R package version 2.6. 2020. <URL: https://github.com/rstudio/rmarkdown>.
[2] C. Boettiger. knitcitations: Citations for ‘Knitr’ Markdown Files. R package version 1.0.12. 2021. <URL: https://github.com/cboettig/knitcitations>.
[3] L. Collado-Torres, A. E. Jaffe, and E. E. Burke. jaffelab: Commonly used functions by the Jaffe lab. R package version 0.99.34. 2024. <URL: https://github.com/LieberInstitute/jaffelab>.
[4] L. Collado-Torres, A. Nellore, K. Kammers, S. E. Ellis, et al. Explore and download data from the recount project. https://github.com/leekgroup/recount - R package version 1.16.1. 2024. DOI: 10.18129/B9.bioc.recount. <URL: http://www.bioconductor.org/packages/recount>.
[5] L. Collado-Torres, A. Nellore, K. Kammers, S. E. Ellis, et al. “Reproducible RNA-seq analysis using recount2”. In: Nature Biotechnology (2017). DOI: 10.1038/nbt.3838. <URL: http://www.nature.com/nbt/journal/v35/n4/full/nbt.3838.html>.
[6] S. E. Ellis, L. Collado-Torres, A. E. Jaffe, and J. T. Leek. “Improving the value of public RNA-seq expression data by phenotype prediction”. In: Nucl. Acids Res. (2018). DOI: 10.1093/nar/gky102. <URL: https://doi.org/10.1093/nar/gky102>.
[7] A. C. Frazee, B. Langmead, and J. T. Leek. “ReCount: A multi-experiment resource of analysis-ready RNA-seq gene count datasets”. In: BMC Bioinformatics (2011). DOI: 10.1186/1471-2105-12-449. <URL: https://doi.org/10.1186/1471-2105-12-449>.
[8] E. Imada, D. F. Sanchez, L. Collado-Torres, C. Wilks, et al. “Recounting the FANTOM CAGE–Associated Transcriptome”. In: Genome Research (2020). DOI: 10.1101/gr.254656.119. <URL: https://doi.org/10.1101/gr.254656.119>.
[9] R. Kolde. pheatmap: Pretty Heatmaps. R package version 1.0.12. 2019.
[10] D. J. McCarthy, Y. Chen, and G. K. Smyth. “Differential expression analysis of multifactor RNA-Seq experiments with respect to biological variation”. In: Nucleic Acids Research 40.10 (2012), pp. 4288-4297. DOI: 10.1093/nar/gks042.
[11] R Core Team. R: A Language and Environment for Statistical Computing. R Foundation for Statistical Computing. Vienna, Austria, 2020. <URL: https://www.R-project.org/>.
[12] Y. Xie, C. Dervieux, and E. Riederer. R Markdown Cookbook. ISBN 9780367563837. Boca Raton, Florida: Chapman and Hall/CRC, 2020. <URL: https://bookdown.org/yihui/rmarkdown-cookbook>.
[13] G. Yu, L. Wang, Y. Han, and Q. He. “clusterProfiler: an R package for comparing biological themes among gene clusters”. In: OMICS: A Journal of Integrative Biology 16.5 (2012), pp. 284-287. DOI: 10.1089/omi.2011.0118.
# Time spent creating this report:
diff(c(timestart, Sys.time()))
## Time difference of 1.790245 mins# Date this report was generated
message(Sys.time())## 2024-12-11 17:00:55# Reproducibility info
options(width = 120)
devtools::session_info()## ─ Session info ───────────────────────────────────────────────────────────────────────────────────────────────────────
## setting value
## version R version 4.0.3 (2020-10-10)
## os Ubuntu 20.04 LTS
## system x86_64, linux-gnu
## ui X11
## language (EN)
## collate en_US.UTF-8
## ctype en_US.UTF-8
## tz Etc/UTC
## date 2024-12-11
##
## ─ Packages ───────────────────────────────────────────────────────────────────────────────────────────────────────────
## package * version date lib source
## AnnotationDbi * 1.52.0 2020-10-27 [1] Bioconductor
## askpass 1.1 2019-01-13 [2] RSPM (R 4.0.3)
## assertthat 0.2.1 2019-03-21 [2] RSPM (R 4.0.3)
## backports 1.2.1 2020-12-09 [1] RSPM (R 4.0.3)
## base64enc 0.1-3 2015-07-28 [2] RSPM (R 4.0.3)
## bibtex 0.5.1 2024-12-11 [1] Github (ropensci/bibtex@12f8bef)
## Biobase * 2.50.0 2020-10-27 [1] Bioconductor
## BiocFileCache 1.14.0 2020-10-27 [1] Bioconductor
## BiocGenerics * 0.36.1 2021-04-16 [1] Bioconductor
## BiocManager 1.30.10 2019-11-16 [1] RSPM (R 4.0.0)
## BiocParallel 1.24.1 2020-11-06 [1] Bioconductor
## BiocStyle * 2.18.1 2020-11-24 [1] Bioconductor
## biomaRt 2.46.3 2021-02-09 [1] Bioconductor
## Biostrings 2.58.0 2020-10-27 [1] Bioconductor
## bit 4.0.4 2020-08-04 [1] RSPM (R 4.0.5)
## bit64 4.0.5 2020-08-30 [1] RSPM (R 4.0.5)
## bitops 1.0-6 2013-08-17 [1] RSPM (R 4.0.3)
## blob 1.2.1 2020-01-20 [1] RSPM (R 4.0.3)
## bookdown 0.21 2020-10-13 [1] RSPM (R 4.0.2)
## BSgenome 1.58.0 2020-10-27 [1] Bioconductor
## bslib 0.2.4 2021-01-25 [1] RSPM (R 4.0.3)
## bumphunter 1.32.0 2020-10-27 [1] Bioconductor
## cachem 1.0.4 2021-02-13 [2] RSPM (R 4.0.3)
## callr 3.5.1 2020-10-13 [2] RSPM (R 4.0.3)
## checkmate 2.0.0 2020-02-06 [1] RSPM (R 4.0.3)
## cli 2.3.0 2021-01-31 [2] RSPM (R 4.0.3)
## cluster 2.1.1 2021-02-14 [3] RSPM (R 4.0.3)
## clusterProfiler * 3.18.1 2021-02-09 [1] Bioconductor
## codetools 0.2-18 2020-11-04 [3] RSPM (R 4.0.3)
## colorspace 2.0-0 2020-11-11 [1] RSPM (R 4.0.3)
## cowplot 1.1.1 2020-12-30 [1] RSPM (R 4.0.5)
## crayon 1.4.1 2021-02-08 [2] RSPM (R 4.0.3)
## crosstalk 1.1.1 2021-01-12 [2] RSPM (R 4.0.3)
## curl 4.3 2019-12-02 [2] RSPM (R 4.0.3)
## data.table 1.13.6 2020-12-30 [1] RSPM (R 4.0.3)
## DBI 1.1.1 2021-01-15 [1] RSPM (R 4.0.3)
## dbplyr 2.1.0 2021-02-03 [1] RSPM (R 4.0.3)
## DelayedArray 0.16.3 2021-03-24 [1] Bioconductor
## derfinder 1.24.2 2020-12-18 [1] Bioconductor
## derfinderHelper 1.24.1 2020-12-18 [1] Bioconductor
## desc 1.2.0 2018-05-01 [2] RSPM (R 4.0.3)
## devtools * 2.3.2 2020-09-18 [2] RSPM (R 4.0.3)
## digest 0.6.27 2020-10-24 [2] RSPM (R 4.0.3)
## DO.db 2.9 2024-12-11 [1] Bioconductor
## doRNG 1.8.2 2020-01-27 [1] RSPM (R 4.0.3)
## DOSE 3.16.0 2020-10-27 [1] Bioconductor
## downloader 0.4 2015-07-09 [1] RSPM (R 4.0.5)
## dplyr 1.0.4 2021-02-02 [1] RSPM (R 4.0.3)
## DT 0.17 2021-01-06 [2] RSPM (R 4.0.3)
## edgeR * 3.32.1 2021-01-14 [1] Bioconductor
## ellipsis 0.3.1 2020-05-15 [2] RSPM (R 4.0.3)
## enrichplot * 1.10.2 2021-01-28 [1] Bioconductor
## evaluate 0.14 2019-05-28 [2] RSPM (R 4.0.3)
## ExploreModelMatrix * 1.2.0 2020-10-27 [1] Bioconductor
## farver 2.0.3 2020-01-16 [1] RSPM (R 4.0.3)
## fastmap 1.1.0 2021-01-25 [2] RSPM (R 4.0.3)
## fastmatch 1.1-0 2017-01-28 [1] RSPM (R 4.0.3)
## fgsea 1.16.0 2020-10-27 [1] Bioconductor
## foreach 1.5.1 2020-10-15 [1] RSPM (R 4.0.3)
## foreign 0.8-81 2020-12-22 [3] RSPM (R 4.0.3)
## Formula 1.2-4 2020-10-16 [1] RSPM (R 4.0.3)
## fs 1.5.0 2020-07-31 [2] RSPM (R 4.0.3)
## generics 0.1.0 2020-10-31 [1] RSPM (R 4.0.3)
## GenomeInfoDb * 1.26.7 2021-04-08 [1] Bioconductor
## GenomeInfoDbData 1.2.4 2024-12-11 [1] Bioconductor
## GenomicAlignments 1.26.0 2020-10-27 [1] Bioconductor
## GenomicFeatures 1.42.3 2021-04-01 [1] Bioconductor
## GenomicFiles 1.26.0 2020-10-27 [1] Bioconductor
## GenomicRanges * 1.42.0 2020-10-27 [1] Bioconductor
## GEOquery 2.58.0 2020-10-27 [1] Bioconductor
## ggforce 0.3.2 2020-06-23 [1] RSPM (R 4.0.3)
## ggnewscale 0.4.5 2021-01-11 [1] RSPM (R 4.0.3)
## ggplot2 * 3.3.3 2020-12-30 [1] RSPM (R 4.0.3)
## ggraph 2.0.4 2020-11-16 [1] RSPM (R 4.0.3)
## ggrepel 0.9.1 2021-01-15 [1] RSPM (R 4.0.3)
## glue 1.4.2 2020-08-27 [2] RSPM (R 4.0.3)
## GO.db 3.12.1 2024-12-11 [1] Bioconductor
## googledrive 1.0.1 2020-05-05 [1] RSPM (R 4.0.0)
## GOSemSim 2.16.1 2020-10-29 [1] Bioconductor
## graphlayouts 0.7.1 2020-10-26 [1] RSPM (R 4.0.3)
## gridExtra 2.3 2017-09-09 [1] RSPM (R 4.0.5)
## gtable 0.3.0 2019-03-25 [1] RSPM (R 4.0.3)
## here * 1.0.1 2020-12-13 [1] RSPM (R 4.0.5)
## highr 0.8 2019-03-20 [2] RSPM (R 4.0.3)
## Hmisc 4.4-2 2020-11-29 [1] RSPM (R 4.0.3)
## hms 1.0.0 2021-01-13 [1] RSPM (R 4.0.3)
## htmlTable 2.1.0 2020-09-16 [1] RSPM (R 4.0.3)
## htmltools 0.5.1.1 2021-01-22 [2] RSPM (R 4.0.3)
## htmlwidgets 1.5.3 2020-12-10 [2] RSPM (R 4.0.3)
## httpuv 1.5.5 2021-01-13 [1] RSPM (R 4.0.3)
## httr 1.4.2 2020-07-20 [2] RSPM (R 4.0.3)
## igraph 1.2.6 2020-10-06 [1] RSPM (R 4.0.3)
## IRanges * 2.24.1 2020-12-12 [1] Bioconductor
## iterators 1.0.13 2020-10-15 [1] RSPM (R 4.0.3)
## jaffelab * 0.99.34 2024-12-11 [1] Github (LieberInstitute/jaffelab@a68c146)
## jpeg 0.1-8.1 2019-10-24 [1] RSPM (R 4.0.3)
## jquerylib 0.1.3 2020-12-17 [1] RSPM (R 4.0.3)
## jsonlite 1.7.2 2020-12-09 [2] RSPM (R 4.0.3)
## knitcitations * 1.0.12 2021-01-10 [1] RSPM (R 4.0.3)
## knitr 1.31 2021-01-27 [2] RSPM (R 4.0.3)
## labeling 0.4.2 2020-10-20 [1] RSPM (R 4.0.3)
## later 1.1.0.1 2020-06-05 [2] RSPM (R 4.0.3)
## lattice 0.20-41 2020-04-02 [3] CRAN (R 4.0.3)
## latticeExtra 0.6-29 2019-12-19 [1] RSPM (R 4.0.3)
## lazyeval 0.2.2 2019-03-15 [2] RSPM (R 4.0.3)
## lifecycle 1.0.0 2021-02-15 [2] RSPM (R 4.0.3)
## limma * 3.46.0 2020-10-27 [1] Bioconductor
## locfit 1.5-9.4 2020-03-25 [1] RSPM (R 4.0.3)
## lubridate 1.7.9.2 2020-11-13 [1] RSPM (R 4.0.3)
## magrittr 2.0.1 2020-11-17 [2] RSPM (R 4.0.3)
## MASS 7.3-53.1 2021-02-12 [3] RSPM (R 4.0.3)
## Matrix 1.3-2 2021-01-06 [3] RSPM (R 4.0.3)
## MatrixGenerics * 1.2.1 2021-01-30 [1] Bioconductor
## matrixStats * 0.58.0 2021-01-29 [1] RSPM (R 4.0.3)
## memoise 2.0.0 2021-01-26 [2] RSPM (R 4.0.3)
## mime 0.10 2021-02-13 [2] RSPM (R 4.0.3)
## munsell 0.5.0 2018-06-12 [1] RSPM (R 4.0.3)
## nnet 7.3-15 2021-01-24 [3] RSPM (R 4.0.3)
## openssl 1.4.3 2020-09-18 [2] RSPM (R 4.0.3)
## org.Hs.eg.db * 3.12.0 2024-12-11 [1] Bioconductor
## pheatmap * 1.0.12 2019-01-04 [1] RSPM (R 4.0.5)
## pillar 1.4.7 2020-11-20 [2] RSPM (R 4.0.3)
## pkgbuild 1.2.0 2020-12-15 [2] RSPM (R 4.0.3)
## pkgconfig 2.0.3 2019-09-22 [2] RSPM (R 4.0.3)
## pkgload 1.1.0 2020-05-29 [2] RSPM (R 4.0.3)
## plotly * 4.9.3 2021-01-10 [1] RSPM (R 4.0.3)
## plyr 1.8.6 2020-03-03 [1] RSPM (R 4.0.3)
## png 0.1-7 2013-12-03 [1] RSPM (R 4.0.3)
## polyclip 1.10-0 2019-03-14 [1] RSPM (R 4.0.3)
## prettyunits 1.1.1 2020-01-24 [2] RSPM (R 4.0.3)
## processx 3.4.5 2020-11-30 [2] RSPM (R 4.0.3)
## progress 1.2.2 2019-05-16 [1] RSPM (R 4.0.3)
## promises 1.2.0.1 2021-02-11 [2] RSPM (R 4.0.3)
## ps 1.5.0 2020-12-05 [2] RSPM (R 4.0.3)
## purrr 0.3.4 2020-04-17 [2] RSPM (R 4.0.3)
## qvalue 2.22.0 2020-10-27 [1] Bioconductor
## R.methodsS3 1.8.1 2020-08-26 [1] RSPM (R 4.0.3)
## R.oo 1.24.0 2020-08-26 [1] RSPM (R 4.0.3)
## R.utils 2.10.1 2020-08-26 [1] RSPM (R 4.0.3)
## R6 2.5.0 2020-10-28 [2] RSPM (R 4.0.3)
## rafalib * 1.0.0 2015-08-09 [1] RSPM (R 4.0.0)
## rappdirs 0.3.3 2021-01-31 [2] RSPM (R 4.0.3)
## RColorBrewer * 1.1-2 2014-12-07 [1] RSPM (R 4.0.3)
## Rcpp 1.0.6 2021-01-15 [2] RSPM (R 4.0.3)
## RCurl 1.98-1.2 2020-04-18 [1] RSPM (R 4.0.3)
## readr 1.4.0 2020-10-05 [1] RSPM (R 4.0.3)
## recount * 1.16.1 2020-12-18 [1] Bioconductor
## RefManageR 1.4.3 2024-12-11 [1] Github (ropensci/RefManageR@d616da5)
## remotes 2.2.0 2020-07-21 [2] RSPM (R 4.0.3)
## rentrez 1.2.3 2020-11-10 [1] RSPM (R 4.0.5)
## reshape2 1.4.4 2020-04-09 [1] RSPM (R 4.0.3)
## rintrojs 0.2.2 2019-05-29 [1] RSPM (R 4.0.0)
## rlang 0.4.10 2020-12-30 [2] RSPM (R 4.0.3)
## rmarkdown 2.6 2020-12-14 [1] RSPM (R 4.0.3)
## rngtools 1.5 2020-01-23 [1] RSPM (R 4.0.3)
## rpart 4.1-15 2019-04-12 [3] CRAN (R 4.0.3)
## rprojroot 2.0.2 2020-11-15 [2] RSPM (R 4.0.3)
## Rsamtools 2.6.0 2020-10-27 [1] Bioconductor
## RSQLite 2.2.3 2021-01-24 [1] RSPM (R 4.0.3)
## rstudioapi 0.13 2020-11-12 [2] RSPM (R 4.0.3)
## rtracklayer 1.50.0 2020-10-27 [1] Bioconductor
## rvcheck 0.1.8 2020-03-01 [1] RSPM (R 4.0.0)
## S4Vectors * 0.28.1 2020-12-09 [1] Bioconductor
## sass 0.3.1 2021-01-24 [1] RSPM (R 4.0.3)
## scales 1.1.1 2020-05-11 [1] RSPM (R 4.0.3)
## scatterpie 0.1.5 2020-09-09 [1] RSPM (R 4.0.2)
## segmented 1.3-2 2021-02-09 [1] RSPM (R 4.0.3)
## sessioninfo 1.1.1 2018-11-05 [1] RSPM (R 4.0.3)
## shadowtext 0.0.7 2019-11-06 [1] RSPM (R 4.0.0)
## shiny 1.6.0 2021-01-25 [1] RSPM (R 4.0.3)
## shinydashboard 0.7.1 2018-10-17 [1] RSPM (R 4.0.3)
## shinyjs 2.0.0 2020-09-09 [1] RSPM (R 4.0.3)
## statmod 1.4.35 2020-10-19 [1] RSPM (R 4.0.3)
## stringi 1.5.3 2020-09-09 [2] RSPM (R 4.0.3)
## stringr 1.4.0 2019-02-10 [2] RSPM (R 4.0.3)
## SummarizedExperiment * 1.20.0 2020-10-27 [1] Bioconductor
## survival 3.2-7 2020-09-28 [3] CRAN (R 4.0.3)
## testthat 3.0.2 2021-02-14 [2] RSPM (R 4.0.3)
## tibble 3.0.6 2021-01-29 [2] RSPM (R 4.0.3)
## tidygraph 1.2.0 2020-05-12 [1] RSPM (R 4.0.3)
## tidyr 1.1.2 2020-08-27 [1] RSPM (R 4.0.3)
## tidyselect 1.1.0 2020-05-11 [1] RSPM (R 4.0.3)
## tweenr 1.0.1 2018-12-14 [1] RSPM (R 4.0.3)
## usethis * 2.0.1 2021-02-10 [1] RSPM (R 4.0.3)
## VariantAnnotation 1.36.0 2020-10-27 [1] Bioconductor
## vctrs 0.3.6 2020-12-17 [2] RSPM (R 4.0.3)
## viridis 0.5.1 2018-03-29 [1] RSPM (R 4.0.3)
## viridisLite 0.3.0 2018-02-01 [1] RSPM (R 4.0.3)
## withr 2.4.1 2021-01-26 [2] RSPM (R 4.0.3)
## xfun 0.21 2021-02-10 [2] RSPM (R 4.0.3)
## XML 3.99-0.5 2020-07-23 [1] RSPM (R 4.0.3)
## xml2 1.3.2 2020-04-23 [2] RSPM (R 4.0.3)
## xtable 1.8-4 2019-04-21 [1] RSPM (R 4.0.5)
## XVector 0.30.0 2020-10-27 [1] Bioconductor
## yaml 2.2.1 2020-02-01 [2] RSPM (R 4.0.3)
## zlibbioc 1.36.0 2020-10-27 [1] Bioconductor
##
## [1] /__w/_temp/Library
## [2] /usr/local/lib/R/site-library
## [3] /usr/local/lib/R/library