7 Pipeline Outputs
7.1 Main Outputs
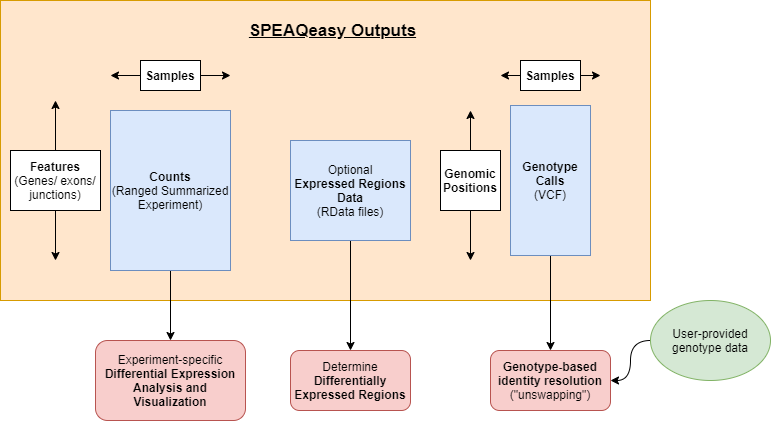
Most importantly, SPEAQeasy generates RangedSummarizedExperiment objects storing counts at several features (genes, exons, exon-exon junctions, and transcripts). A number of Bioconductor packages can be trivially utilized to perform desired differential expression analyses from counts in the widespread SummarizedExperiment format, and we provide a vignette demonstrating an example analysis.
For human samples, variants are called at a list of common missense single nucleotide variants (SNVs), and SPEAQeasy ultimately a single VCF file to store genotype calls at these sites for all samples in the experiment. We provide a guide walking through how this genotype data can be used to resolve identity issues that arise during sequencing, salvaging samples which otherwise might be dropped from further analysis.
Finally, expressed regions data is optionally generated (with the --coverage option). The RData files provide a starting point for finding differentially expressed regions (DERs), for analyses involving this end goal.
7.1.1 metadata of RSE objects
The metadata of each object (e.g. metadata(rse_gene)) is a list with one element (SPEAQeasy_settings) containing every setting SPEAQeasy was run with.
7.1.2 rowRanges of RSE objects
For the rse_tx object, all columns of its rowRanges are directly pulled from the annotation GTF, and thus will not be described below. The remaining objects have columns extracted or computed from several different sources.
7.1.2.1 Pulled from featureCounts outputs
| Column Name | Description | Species | RSE object(s) |
|---|---|---|---|
seqnames |
directly pulled | human, mouse, rat | rse_exon, rse_jx |
ranges |
directly pulled | human, mouse, rat | rse_exon, rse_jx |
strand |
directly pulled | human, mouse, rat | rse_exon, rse_jx |
Length |
directly pulled | human, mouse, rat | rse_gene, rse_exon, rse_jx |
ensemblID |
truncated from Geneid (genes, exons) or gencodeID (junctions) |
human, mouse | rse_gene, rse_exon, rse_jx |
gencodeID |
is Geneid |
human, mouse | rse_gene, rse_exon |
Symbol |
directly pulled | rat | rse_gene, rse_exon |
EntrezID |
directly pulled | rat | rse_gene, rse_exon |
exon_gencodeID |
is exon_id |
human, mouse, rat | rse_exon |
coord |
ranges pasted into a string | human, mouse, rat | rse_exon |
In addition, the rownames for rse_gene are Geneid from featureCounts.
7.1.2.2 Pulled directly from GTF
| Column Name | Description | Species | RSE object(s) |
|---|---|---|---|
seqnames |
directly pulled | human, mouse, rat | rse_gene |
ranges |
directly pulled | human, mouse, rat | rse_gene |
strand |
directly pulled | human, mouse, rat | rse_gene |
gene_type |
directly pulled | human, mouse | rse_gene, rse_exon |
gencodeGeneID |
is gencodeID |
human, mouse | rse_jx |
gencodeStrand |
is strand | human, mouse | rse_jx |
gencodeTx |
is tx |
human, mouse | rse_jx |
ensemblGeneID |
is ensemblID |
rat | rse_jx |
ensemblStrand |
is strand | rat | rse_jx |
ensemblTx |
is tx |
rat | rse_jx |
7.1.2.3 Mapped using org.*.eg.db R packages
| Column Name | Description | Species | RSE object(s) |
|---|---|---|---|
Symbol |
mapped from info pulled from GTF | human, mouse | rse_gene, rse_exon |
EntrezID |
mapped from info pulled from GTF | human, mouse | rse_gene, rse_exon |
7.1.2.4 Computed by SPEAQeasy
| Column Name | Description | Species | RSE object(s) |
|---|---|---|---|
meanExprs |
the rowmeans of computed RPKMs | human, mouse, rat | rse_gene, rse_exon, rse_jx |
NumTx |
number of transcripts associated with a particular gene name (called numTx in rse_jx) |
human, mouse, rat | rse_gene, rse_exon, rse_jx |
Class |
holds the value “InGen”, meaning the gene is part of GENCODE annotation (as opposed to possible values in the rse_jx object) |
human, mouse, rat | rse_gene, rse_exon |
gencodeTx |
GENCODE names for transcripts associated with each gene | human, mouse, rat | rse_gene, rse_exon |
exon_libdID |
a string made from “e” and integers pasted together, where the integer value is the index of the exon in the rows of rse_exon (this column may be removed in the future) |
human, mouse | rse_exon |
inGencode (inEnsembl) |
TRUE for featureCounts ranges that are exactly present in GENCODE (Ensembl) annotation |
human, mouse, rat | rse_jx |
inGencodeStart (inEnsemblStart) |
TRUE for featureCounts ranges whose start is the same as the corresponding junction in GENCODE (Ensembl) annotation |
human, mouse, rat | rse_jx |
inGencodeEnd (inEnsemblEnd) |
TRUE for featureCounts ranges whose end is the same as the corresponding junction in GENCODE (Ensembl) annotation |
human, mouse, rat | rse_jx |
Class |
“InGen” (“InEns”) if the exact junction is present in GENCODE (Ensembl) annotation, otherwise: “ExonSkip” if the junction start and end match a junction in annotation, “AltStartEnd” if either the junction start or end match (but not both), or “Novel” if neither start nor end match | human, mouse, rat | rse_jx |
newGeneID |
gene name or gene names associated with the exons that each junction spans | human, mouse, rat | rse_jx |
isFusion |
TRUE if a junction spans exons associated with different genes |
human, mouse, rat | rse_jx |
7.1.3 colData of RSE objects
Many of the columns in the colData of each RSE object are considered “quality metrics”, which are documented in the next section and also contained in a standalone CSV output. The remaining columns in the colData of each object have names of the form: gene_Assigned and geneUnassigned_*, and are pulled directly from the featureCounts summary outputs. Note that all objects (rse_gene, rse_exon, rse_jx, and rse_tx) share identical colData.
7.1.4 Quality Metrics
One of the major pipeline outputs is a comma-separated values (CSV) file where fields (columns) are different quality metrics, and each line (row) is associated with one sample. A list of the exact field names and their descriptions is given below.
| Metric name | Description |
|---|---|
| SAMPLE_ID | The name of the sample, as specified in the last column of samples.manifest |
| strandness | The strandness of the sample. When using --strand_mode declare, this is simply the user-passed value to --strand; otherwise, it is the inferred strandness from pseudoalignment. |
| ERCCsumLogErr | If applicable, a summary statistic quantifying overall difference of expected and actual ERCC concentrations for one sample |
| trimmed | A boolean value (“TRUE” or “FALSE”), indicating whether the given sample underwent trimming |
| numReads | The number of reads present in any FASTQ files associated with the sample (after any trimming) |
| numMapped | The number of reads which successfully mapped to the reference genome during alignment |
| numUnmapped | The number of reads which did not successfully map to the reference genome during alignment |
| overallMapRate | The decimal fraction of reads which successfully mapped to the reference genome (i.e. numMapped / numReads) |
| concordMapRate | The decimal fraction of reads which aligned concordantly to the reference genome |
| totalMapped | The number of reads which successfully mapped to the canonical sequences in the reference genome (excluding mitochondrial chromosomes) |
| mitoMapped | The number of reads which successfully mapped to the mitochondrial chromosome |
| mitoRate | The decimal fraction of reads which mapped to the mitochondrial chromosome, of those which map at all (i.e. mitoMapped / (totalMapped + mitoMapped)) |
| totalAssignedGene | The decimal fraction of reads assigned unambiguously to a gene, with featureCounts (Liao et al. 2014), of those in total |
| rRNA_rate | The decimal fraction of reads assigned to a gene whose type is ‘rRNA’, of those assigned to any gene |
The quality metrics also include metrics from FastQC, documented here. In SPEAQeasy, these metrics have names: basic_statistics, per_base_sequence_quality, per_tile_sequence_quality, per_sequence_quality_scores, per_base_sequence_content, per_sequence_gc_content, per_base_n_content, sequence_length_distribution, sequence_duplication_levels, overrepresented_sequences, adapter_content, kmer_content. The corresponding metrics from FastQC are named in uppercase with spaces, rather than lowercase with underscores.
7.2 Intermediary Outputs
SPEAQeasy generates a number of files along the process before producing the main outputs of interest. Each of these “intermediary” files is described below.
Count Objects count_objects/
ercc_spikein_check_mix1.pdf: A plot comparing the Mix1 expected concentration against the observed counts from Kallisto.rawCounts_[experiment_name]_n[num_samples].rda: An R data file containing a number of matrices/ data frames containing raw gene, exon, exon-exon junction, and transcript counts. A data frame of quality metrics is also included.read_and_alignment_metrics_[experiment_name].csv: A comma-separated values file of quality metrics.rpkm_counts_[experiment_name]_n[num_samples].rda: The same data as in rawCounts_[experiment_name]_n[num_samples].rda, but normalized as reads-per-kilobase-million (RPKM).
Raw Counts counts/
- [sample_name]_[annotation_version]_Exons.counts`: Exon counts for each sample individually, as reported by featureCounts.
[sample_name]_[annotation_version]_Exons.counts.summary: A summary of key information generated from quantifying exons on a particular sample with featureCounts.[sample_name]_[annotation_version]_Gene.counts: Gene counts for each sample individually, as reported by featureCounts.[sample_name]_[annotation_version]_Gene.counts.summary: A summary of key information generated from quantifying genes on a particular sample with featureCounts.junction/[sample_name]_junctions_primaryOnly_regtools.bed: A file in BED format describing junctions determined by regtools run on primary alignments for a given sample.junction/[sample_name]_junctions_primaryOnly_regtools.count: A text file describing the junction ranges and providing raw counts of hits for each junction, as output by regtools.junction/primary_alignments/[sample_name].bamandjunction/primary_alignments/[sample_name].bam.bai: The subset of primary alignments for a given sample, in BAM format, along with an index for each BAM.
ERCC Raw Quantification ERCC/
ERCC/[sample_name]/abundance.tsv: The output from running Kallisto against the 92 ERCC RNA Spike Mix sequences for each sample.
Coverage wigs and bigWigs coverage/
[sample_name].[strand].wig: Wiggle files containing coverage information for a given sample and strand.mean/mean.forward.bwandmean/mean.reverse.bw: BigWig files containing coverage information averaged across all samples in the experiment, and split by strand.
Expressed Regions Data expressed_regions/
region_cuts_raw_[strand].Rdata: An R object calledregion_cuts_rawthat is a list with one element per chromosome, then a nested element per cutoff used for identifying expressed regions usingderfinder::findRegions().region_cuts_[strand].Rdata: An R object calledregion_cutsthat is a list with one element per cutoff that contains aGenomicRanges::GRanges()object with the expressed regions across all chromosomes.region_info_[strand].Rdata: An R object calledregInfothat is adata.framewith the columns:cutoff,n,mean, andsd. This table summarizes the number, mean width, sd of the width for the expressed regions identified at each cutoff.region_info_[strand].pdf: A PDF with a few exploratory plots made usingregInfothat evaluate how the cutoff for identifying the expressed regions affects the number of ERs, their mean width, the sd of their width. These are the visualization plots recommended for choosing a cutoff as described on thederfindermanuscript at Figure S4 available here.
FastQC Outputs fastQC/
- [trim_status]/[file_name]/*`: Outputs from FastQC. Here trim_status indicates when FastQC was performed: Untrimmed is before trimming, and Trimmed is after. file_name contains the sample name, and if applicable, the mate number.
Alignment BAMs and Summaries alignment/
[sample_name].bam: The main alignment output from Hisat2 or optionally STAR in BAM format. In either case, unmapped reads are not included (different from the default behavior for HISAT2!).[sample_name]_align_summary.txt: The text-based alignment summary from Hisat2, if applicable. Note that metrics from these files are aggregated for the experiment, and so users likely will not need to check or process the original files manually.[sample_name]_STAR_alignment.log: Statistics from STAR alignment (if applicable) for a single sample, renamed fromLog.final.out. Note that metrics from these files are aggregated for the experiment, and so users likely will not need to check or process the original files manually.- bam_sort/[sample_name]_sorted.bam
andbam_sort/[sample_name]_sorted.bam.bai`: Coordinate-sorted alignments and their corresponding indices. [sample_name]_unmapped_mate*.fastq: If using STAR with paired-end reads and the--unalignoption, these two files (mates 1 and 2) are produced, including unmapped reads (this includes “discordant” reads).[sample_name]_discordant.fastq: If using HISAT2 (this is the default) and the--unalignoption, this file is produced and includes discordant mappings.
Outputs from Strand Inference infer_strandness/
[sample_name]_strandness_pattern.txt: A text file containing the inferred strandness pattern for each sample. These files are primarily for internal use by the pipeline, and it is recommended to check the output filesamples_complete.manifestto quickly view strandness patterns for all samples.samples_complete.manifest: A version of the input samples.manifest, with an additional column listing the inferred strandness pattern for each sample
Transcript Quantification by Sample kallisto_tx/
[sample_name]/abundance.h5: Abundance estimates, bootstrap estimates, run metadata, and transcript length from Kallisto, saved into an HDF5 binary file.[sample_name]/[sample_name]_abundance.tsv: Plain-text abundance estimates from Kallisto across the reference transcriptome.[sample_name]/run_info.json: Kallisto run metadata in javascript object notation.
SPEAQeasy Logs by Sample logs/
[sample_name]_process_trace.log: A SPEAQeasy-generated log tracing the processes and associated commands run for each sample. This is intended to help users quickly determine the source of any errors during pipeline execution (text).
Trimmed FASTQ Files trimming/
[sample_name]_trimmed*.fastq: Trimmed FASTQ files, if applicable, from Trimmomatic