Plot the gene set enrichment results with ComplexHeatmap
Source:R/gene_set_enrichment_plot.R
gene_set_enrichment_plot.RdThis function takes the output of gene_set_enrichment() and creates a
ComplexHeatmap visualization of the results. Fill of the heatmap represents
the -log10(p-val), Odds-ratios are printed for test that pass specified
significance threshold ORcut.
gene_set_enrichment_plot(
  enrichment,
  xlabs = unique(enrichment$ID),
  PThresh = 12,
  ORcut = 3,
  enrichOnly = FALSE,
  mypal = c("white", RColorBrewer::brewer.pal(9, "YlOrRd")),
  plot_SetSize_bar = FALSE,
  gene_list_length = NULL,
  model_sig_length = NULL,
  model_colors = NULL,
  ...
)
Arguments
- enrichment
The output of
gene_set_enrichment().- xlabs
A vector of names in the same order and length as
unique(enrichment$ID).- PThresh
A
numeric(1)specifying the P-value threshold for the maximum value in the-log10(p)scale.- ORcut
A
numeric(1)specifying the P-value threshold for the minimum value in the-log10(p)scale for printing the odds ratio values in the cells of the resulting plot. Defaults to 3 or p-val < 0.001.- enrichOnly
A
logical(1)indicating whether to show only odds ratio values greater than 1.- mypal
A
charactervector with the color palette to use. Colors will be in order from 0 to lowest P-valmax(-log(enrichment$Pval)). Defaults to white, yellow, red pallet.- plot_SetSize_bar
A
logical(1)indicating whether to plot SetSize fromenrichmentas ananno_barplotat the top of the heatmap.- gene_list_length
Optional named
numericvector indicating the length of thegene_listused to calculateenrichment, if included andplot_setSize_bar = TRUEthen the topanno_barplotwill show theSetSizeand the difference from the length of the input gene_list.- model_sig_length
Optional named
numericvector indicating the number of significant genes inmodeling_resultsused to calculateenrichment. If includedanno_barplotwill be added to rows.- model_colors
named
charactervector of colors. It adds colors to row annotations.- ...
Additional parameters passed to
ComplexHeatmap::Heatmap().
Value
A (Heatmap-class) visualizing the gene set enrichment odds ratio and p-value results.
Details
Includes functionality to plot the size of the input gene sets as barplot annotations.
Check https://github.com/LieberInstitute/HumanPilot/blob/master/Analysis/Layer_Guesses/check_clinical_gene_sets.R to see a full script from where this family of functions is derived from.
See also
Other Gene set enrichment functions:
gene_set_enrichment()
Examples
## Read in the SFARI gene sets included in the package
asd_sfari <- utils::read.csv(
system.file(
"extdata",
"SFARI-Gene_genes_01-03-2020release_02-04-2020export.csv",
package = "spatialLIBD"
),
as.is = TRUE
)
## Format them appropriately
asd_safari_geneList <- list(
Gene_SFARI_all = asd_sfari$ensembl.id,
Gene_SFARI_high = asd_sfari$ensembl.id[asd_sfari$gene.score < 3],
Gene_SFARI_syndromic = asd_sfari$ensembl.id[asd_sfari$syndromic == 1]
)
## Obtain the necessary data
if (!exists("modeling_results")) {
modeling_results <- fetch_data(type = "modeling_results")
}
#> 2026-03-27 00:05:53.910977 loading file /github/home/.cache/R/BiocFileCache/f2e71d5f5d9_Human_DLPFC_Visium_modeling_results.Rdata%3Fdl%3D1
## Compute the gene set enrichment results
asd_sfari_enrichment <- gene_set_enrichment(
gene_list = asd_safari_geneList,
modeling_results = modeling_results,
model_type = "enrichment"
)
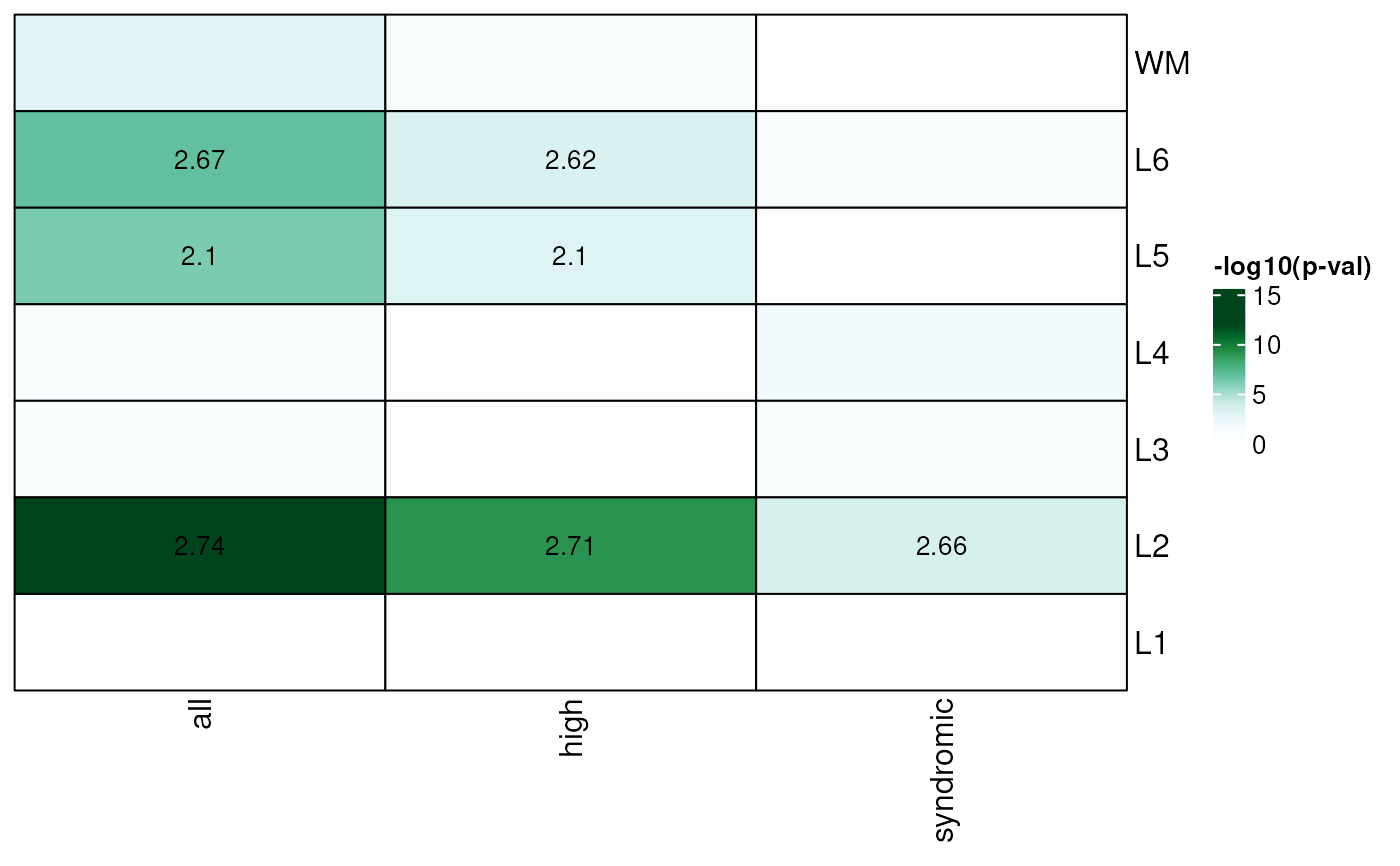
## Visualize the gene set enrichment results
## Default plot
gene_set_enrichment_plot(
enrichment = asd_sfari_enrichment
)
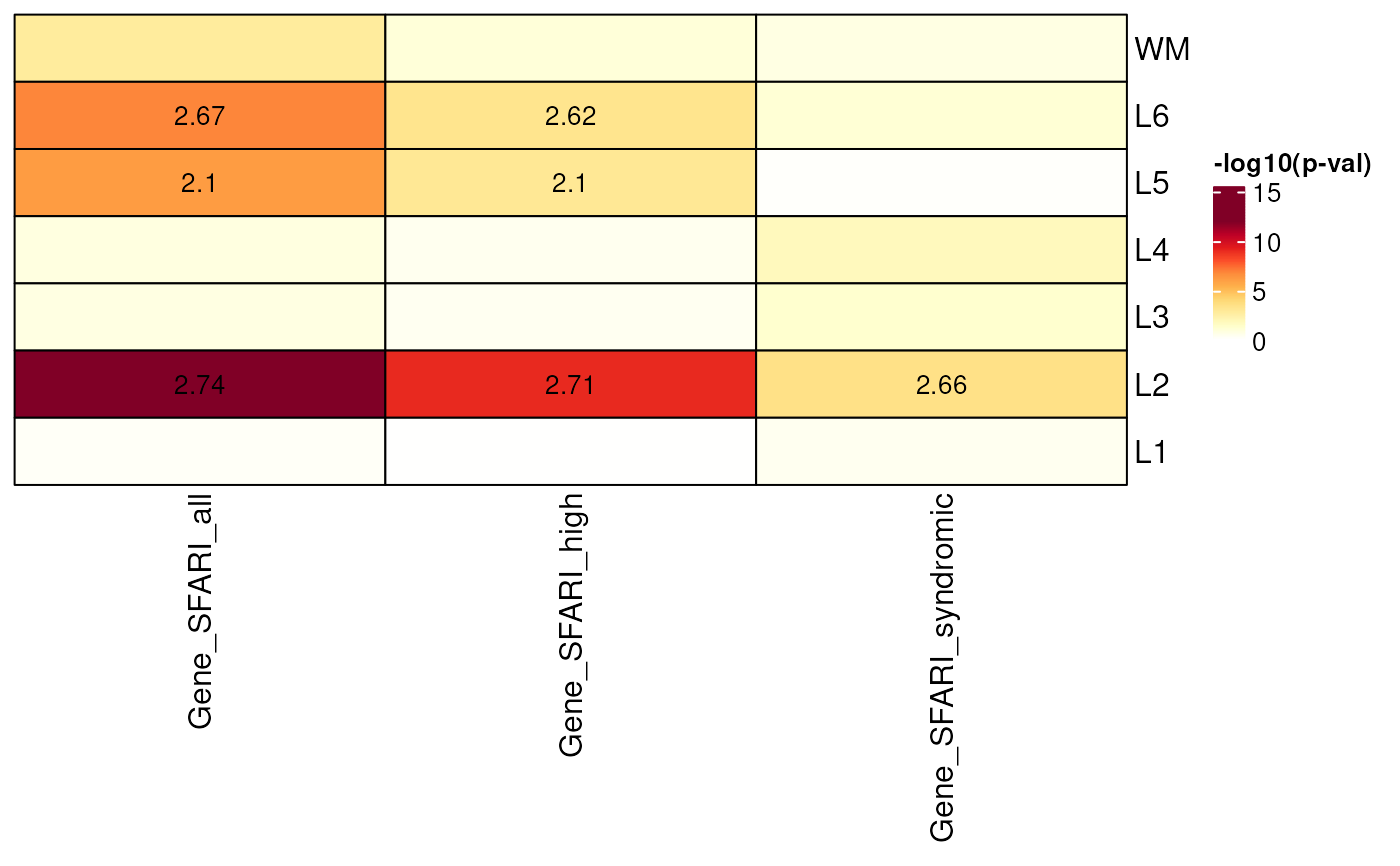 ## Use a custom green color palette & use shorter gene set names
## (x-axis labels)
gene_set_enrichment_plot(
asd_sfari_enrichment,
xlabs = gsub(".*_", "", unique(asd_sfari_enrichment$ID)),
mypal = c("white", RColorBrewer::brewer.pal(9, "BuGn"))
)
## Use a custom green color palette & use shorter gene set names
## (x-axis labels)
gene_set_enrichment_plot(
asd_sfari_enrichment,
xlabs = gsub(".*_", "", unique(asd_sfari_enrichment$ID)),
mypal = c("white", RColorBrewer::brewer.pal(9, "BuGn"))
)
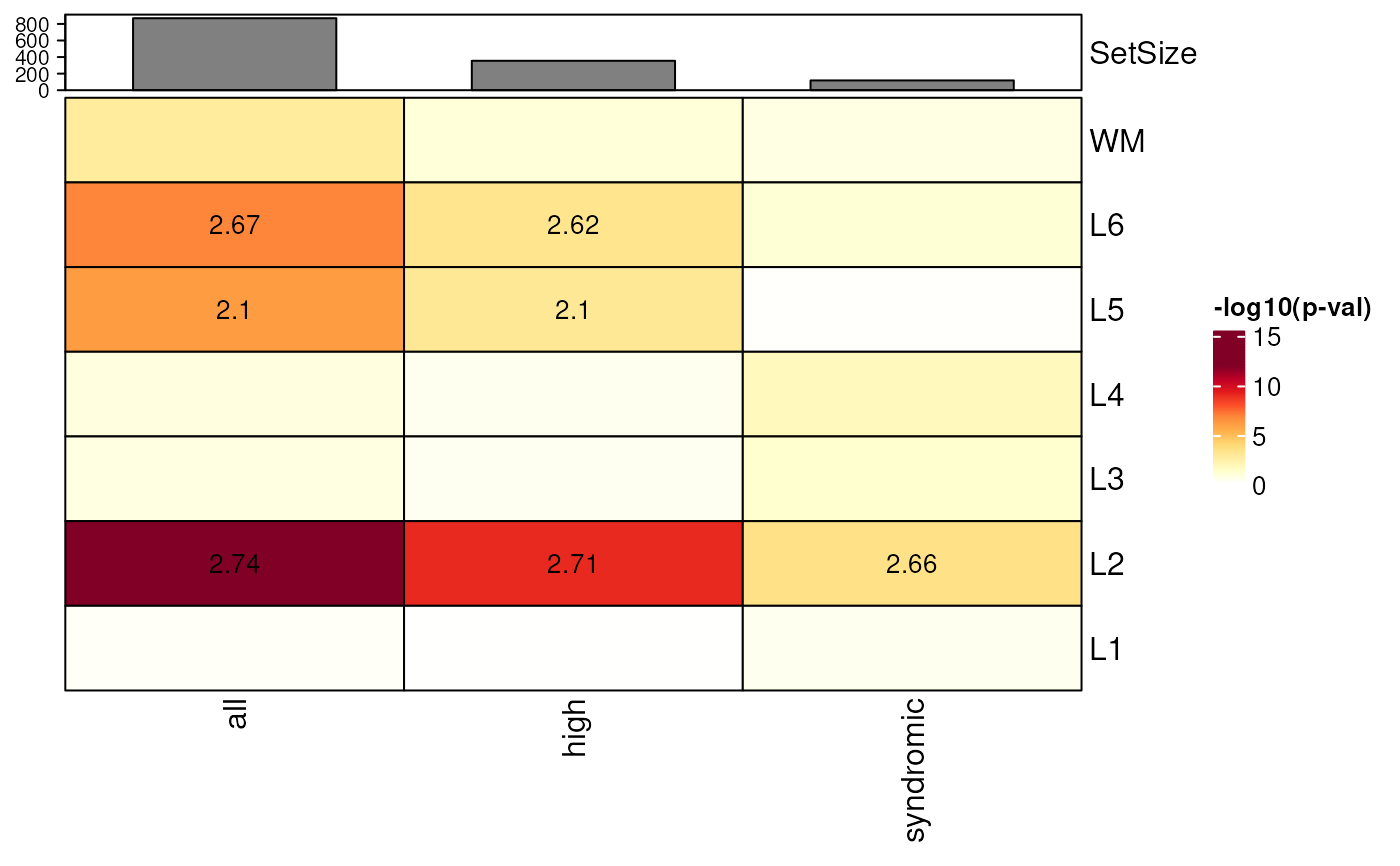
 ## Add bar plot annotations for SetSize of model genes in the gene_lists
gene_set_enrichment_plot(
asd_sfari_enrichment,
xlabs = gsub(".*_", "", unique(asd_sfari_enrichment$ID)),
plot_SetSize_bar = TRUE
)
## Add bar plot annotations for SetSize of model genes in the gene_lists
gene_set_enrichment_plot(
asd_sfari_enrichment,
xlabs = gsub(".*_", "", unique(asd_sfari_enrichment$ID)),
plot_SetSize_bar = TRUE
)
 ## Add stacked bar plot annotations showing SetSize and difference from the
## length of the input gene_list
gene_set_enrichment_plot(
asd_sfari_enrichment,
xlabs = gsub(".*_", "", unique(asd_sfari_enrichment$ID)),
plot_SetSize_bar = TRUE,
gene_list_length = lapply(asd_safari_geneList, length)
)
## Add stacked bar plot annotations showing SetSize and difference from the
## length of the input gene_list
gene_set_enrichment_plot(
asd_sfari_enrichment,
xlabs = gsub(".*_", "", unique(asd_sfari_enrichment$ID)),
plot_SetSize_bar = TRUE,
gene_list_length = lapply(asd_safari_geneList, length)
)
 ## add bar plot annotations for number of enriched genes from layers
if (!exists("sce_layer")) sce_layer <- fetch_data(type = "sce_layer")
#> 2026-03-27 00:05:58.702695 loading file /github/home/.cache/R/BiocFileCache/f2e647b6693_Human_DLPFC_Visium_processedData_sce_scran_sce_layer_spatialLIBD.Rdata%3Fdl%3D1
sig_genes <- sig_genes_extract(
modeling_results = modeling_results,
model = "enrichment",
sce_layer = sce_layer,
n = nrow(sce_layer)
)
sig_genes <- sig_genes[sig_genes$fdr < 0.1, ]
n_sig_model <- as.list(table(sig_genes$test))
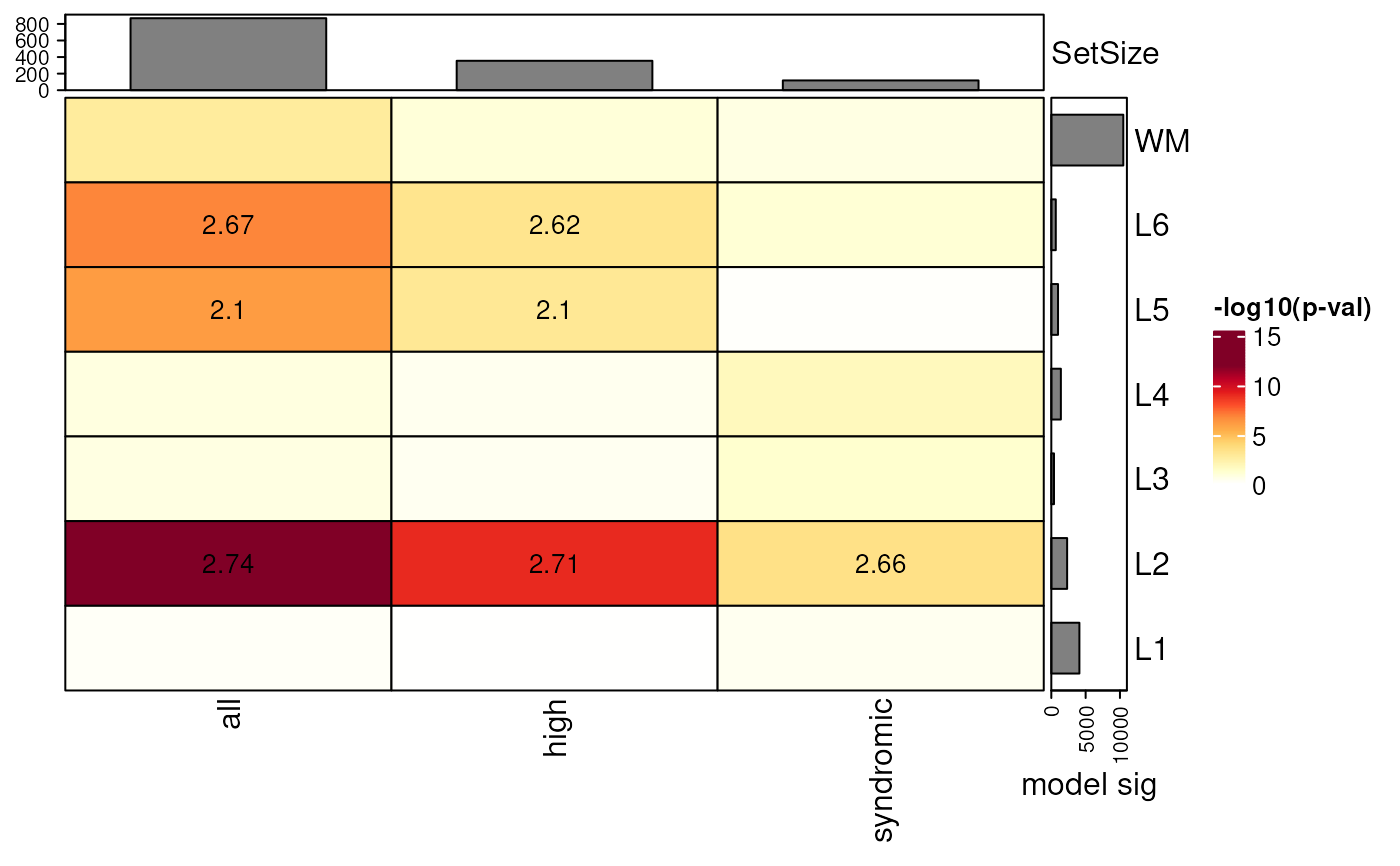
## add barplot with n significant genes from modeling
gene_set_enrichment_plot(
asd_sfari_enrichment,
xlabs = gsub(".*_", "", unique(asd_sfari_enrichment$ID)),
plot_SetSize_bar = TRUE,
model_sig_length = n_sig_model
)
## add bar plot annotations for number of enriched genes from layers
if (!exists("sce_layer")) sce_layer <- fetch_data(type = "sce_layer")
#> 2026-03-27 00:05:58.702695 loading file /github/home/.cache/R/BiocFileCache/f2e647b6693_Human_DLPFC_Visium_processedData_sce_scran_sce_layer_spatialLIBD.Rdata%3Fdl%3D1
sig_genes <- sig_genes_extract(
modeling_results = modeling_results,
model = "enrichment",
sce_layer = sce_layer,
n = nrow(sce_layer)
)
sig_genes <- sig_genes[sig_genes$fdr < 0.1, ]
n_sig_model <- as.list(table(sig_genes$test))
## add barplot with n significant genes from modeling
gene_set_enrichment_plot(
asd_sfari_enrichment,
xlabs = gsub(".*_", "", unique(asd_sfari_enrichment$ID)),
plot_SetSize_bar = TRUE,
model_sig_length = n_sig_model
)
 ## add color annotations
gene_set_enrichment_plot(
asd_sfari_enrichment,
xlabs = gsub(".*_", "", unique(asd_sfari_enrichment$ID)),
plot_SetSize_bar = TRUE,
model_colors = libd_layer_colors
)
## add color annotations
gene_set_enrichment_plot(
asd_sfari_enrichment,
xlabs = gsub(".*_", "", unique(asd_sfari_enrichment$ID)),
plot_SetSize_bar = TRUE,
model_colors = libd_layer_colors
)
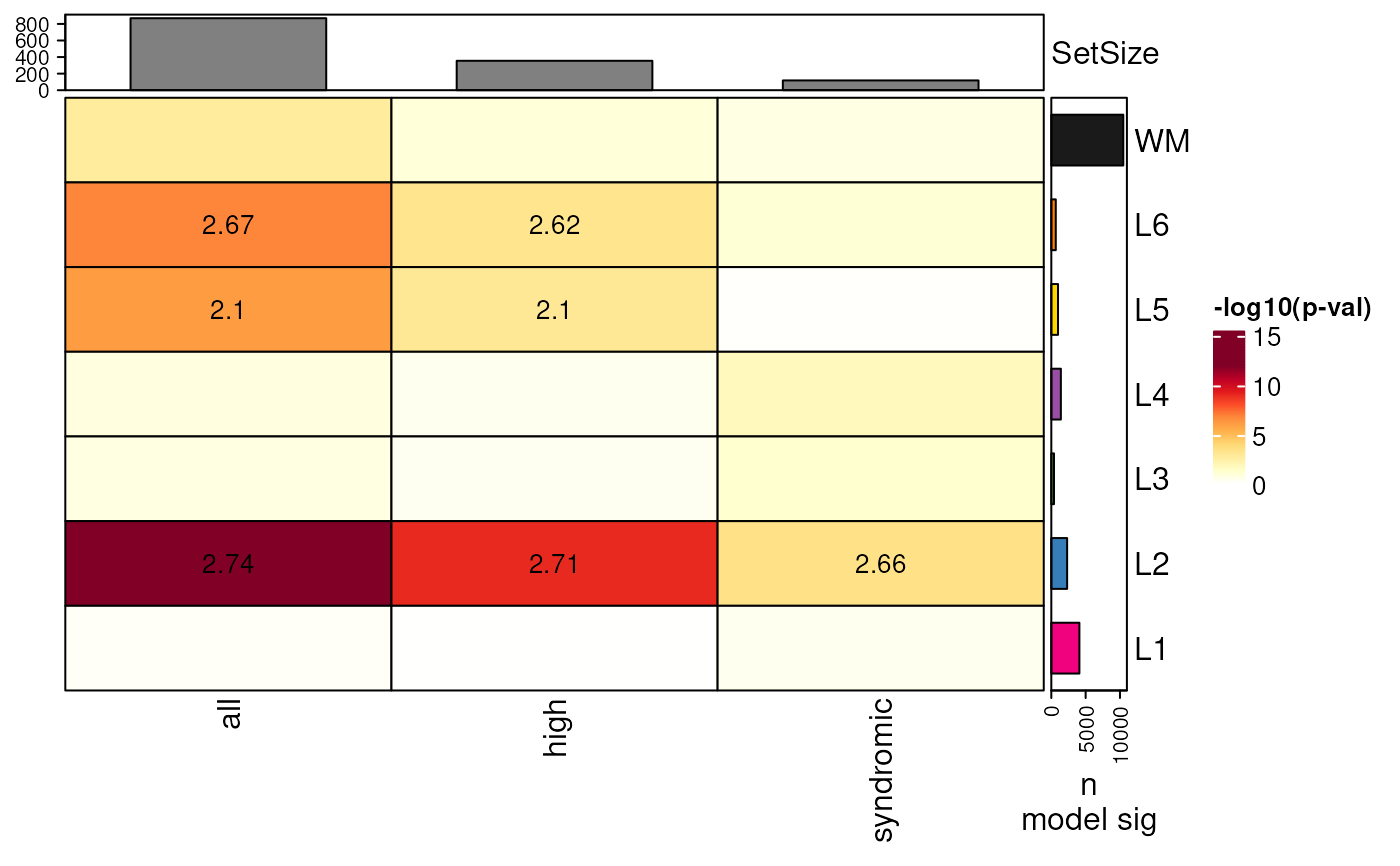
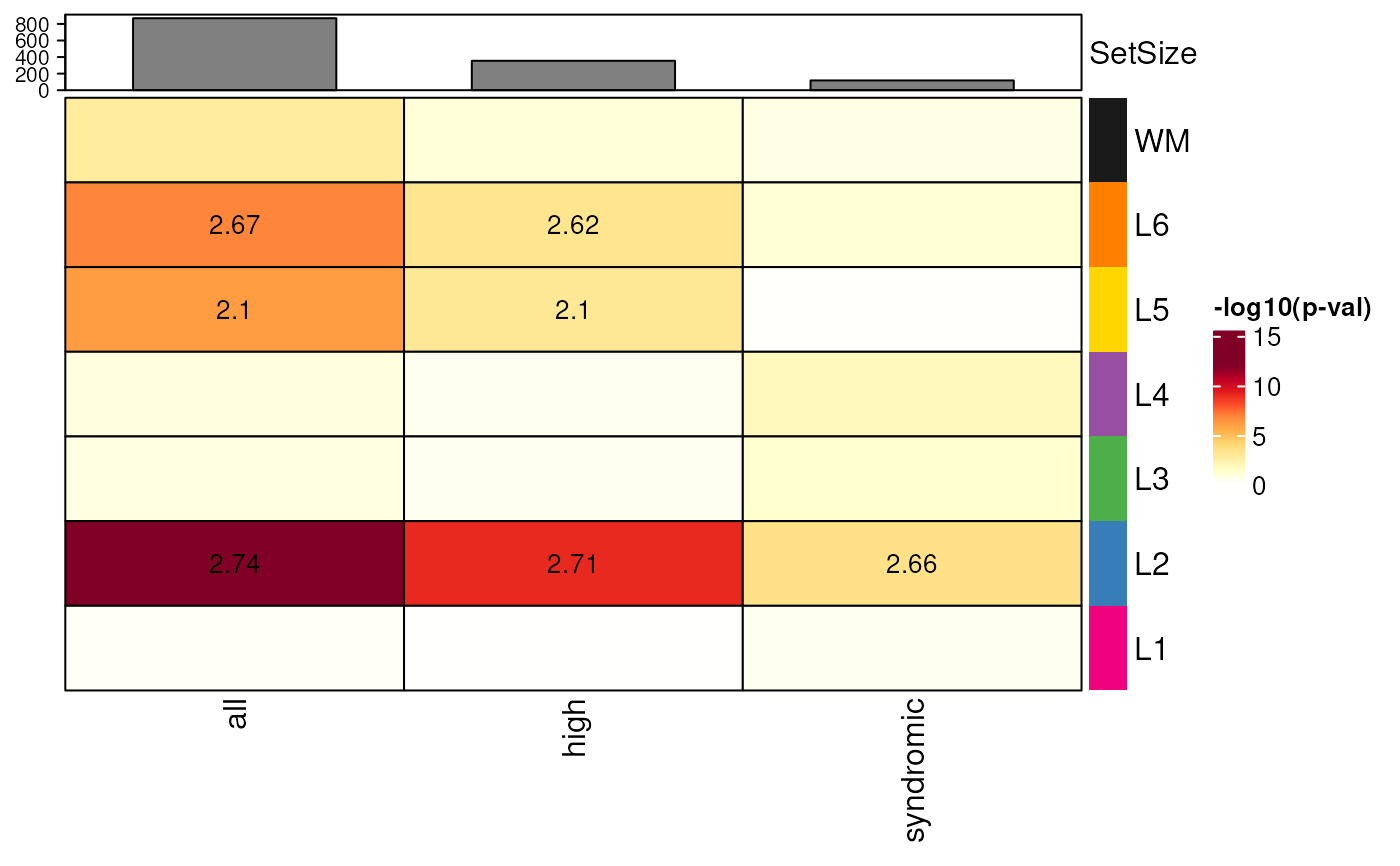 ## add barplot with n significant genes from modeling filled with model color
gene_set_enrichment_plot(
asd_sfari_enrichment,
xlabs = gsub(".*_", "", unique(asd_sfari_enrichment$ID)),
plot_SetSize_bar = TRUE,
model_sig_length = n_sig_model,
model_colors = libd_layer_colors
)
## add barplot with n significant genes from modeling filled with model color
gene_set_enrichment_plot(
asd_sfari_enrichment,
xlabs = gsub(".*_", "", unique(asd_sfari_enrichment$ID)),
plot_SetSize_bar = TRUE,
model_sig_length = n_sig_model,
model_colors = libd_layer_colors
)