This function uses the output of sig_genes_extract_all() as well as the
logcounts from the layer-level (group-level) data to visualize the expression
of a given gene and display the modeling results for the given gene.
layer_boxplot(
  i = 1,
  sig_genes = sig_genes_extract(),
  short_title = TRUE,
  sce_layer = fetch_data(type = "sce_layer"),
  col_bkg_box = "grey80",
  col_bkg_point = "grey40",
  col_low_box = "violet",
  col_low_point = "darkviolet",
  col_high_box = "skyblue",
  col_high_point = "dodgerblue4",
  cex = 2,
  group_var = "layer_guess_reordered_short",
  assayname = "logcounts"
)
Arguments
- i
A
integer(1)indicating which row ofsig_genesdo you want to plot.- sig_genes
The output of
sig_genes_extract_all().- short_title
A
logical(1)indicating whether to print a short title or not.- sce_layer
Defaults to the output of
fetch_data(type = 'sce_layer'). This is a SingleCellExperiment object with the spot-level Visium data compressed via pseudo-bulking to the layer-level (group-level) resolution. Seefetch_data()for more details.- col_bkg_box
Box background color for layers not used when visualizing the
pairwisemodel results.- col_bkg_point
Similar to
col_bkg_boxbut for the points.- col_low_box
Box background color for layer(s) with the expected lower expression based on the actual test for row
iofsig_genes.- col_low_point
Similar to
col_low_boxbut for the points.- col_high_box
Similar to
col_low_boxbut for the expected layer(s) with higher expression.- col_high_point
Similar to
col_high_boxbut for the points.- cex
Controls the size of the text, points and axis legends.
- group_var
A
character(1)specifying acolData(sce_layer)column name to use for the x-axis.- assayname
A
character(1)specifying the default assay to use fromassays(sce_layer).
Value
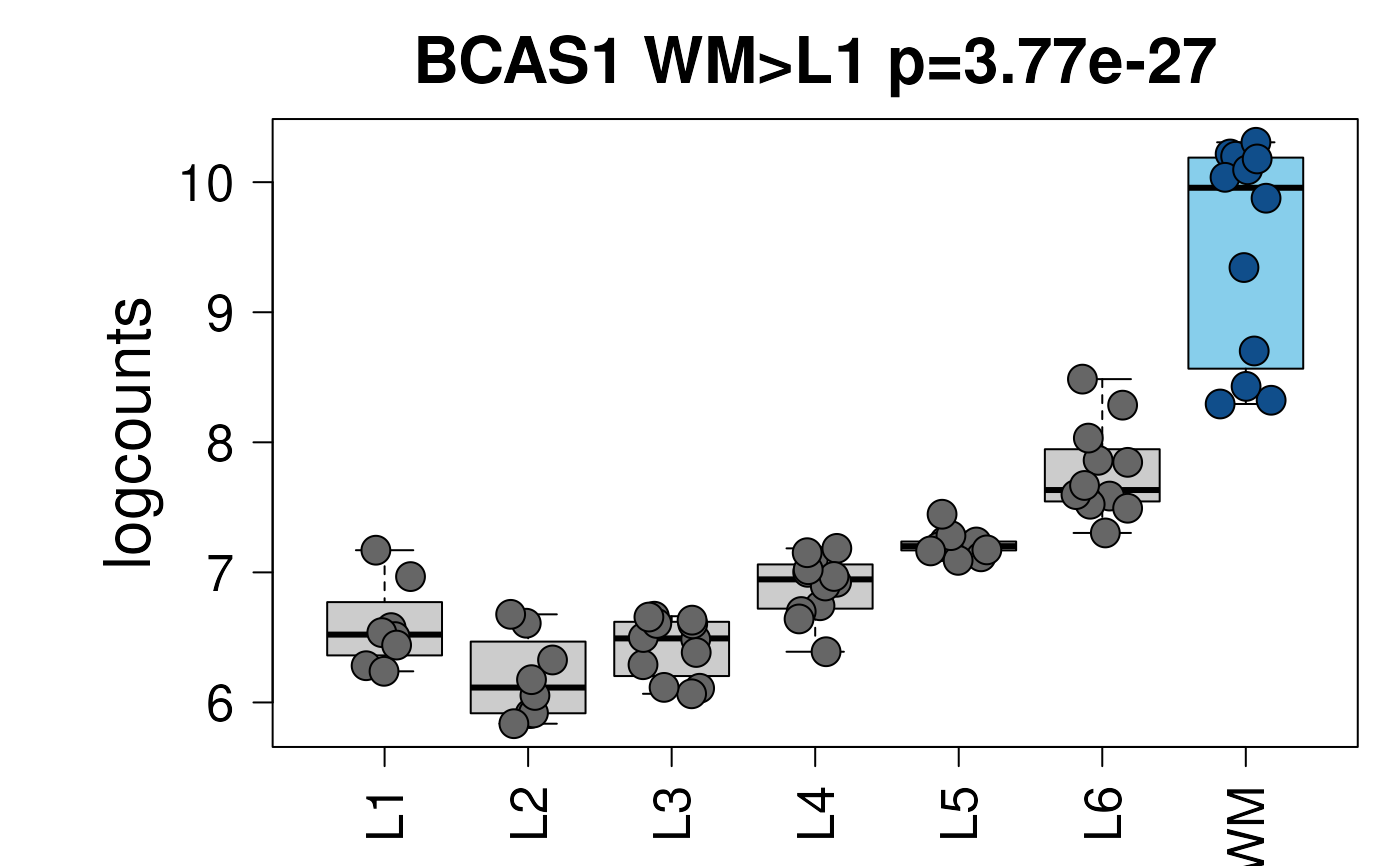
This function creates a boxplot of the layer-level data
(group-level) separated by layer and colored based on the model type from row
i of sig_genes.
References
Adapted from https://github.com/LieberInstitute/HumanPilot/blob/master/Analysis/Layer_Guesses/layer_specificity.R
See also
Other Layer modeling functions:
sig_genes_extract(),
sig_genes_extract_all()
Examples
## Obtain the necessary data
if (!exists("modeling_results")) {
modeling_results <- fetch_data(type = "modeling_results")
}
#> 2026-01-09 17:23:03.709229 loading file /github/home/.cache/R/BiocFileCache/101f43b88241_Human_DLPFC_Visium_modeling_results.Rdata%3Fdl%3D1
if (!exists("sce_layer")) sce_layer <- fetch_data(type = "sce_layer")
#> 2026-01-09 17:23:04.635051 loading file /github/home/.cache/R/BiocFileCache/101f6597747f_Human_DLPFC_Visium_processedData_sce_scran_sce_layer_spatialLIBD.Rdata%3Fdl%3D1
## Top 2 genes from the enrichment model
sig_genes <- sig_genes_extract_all(
n = 2,
modeling_results = modeling_results,
sce_layer = sce_layer
)
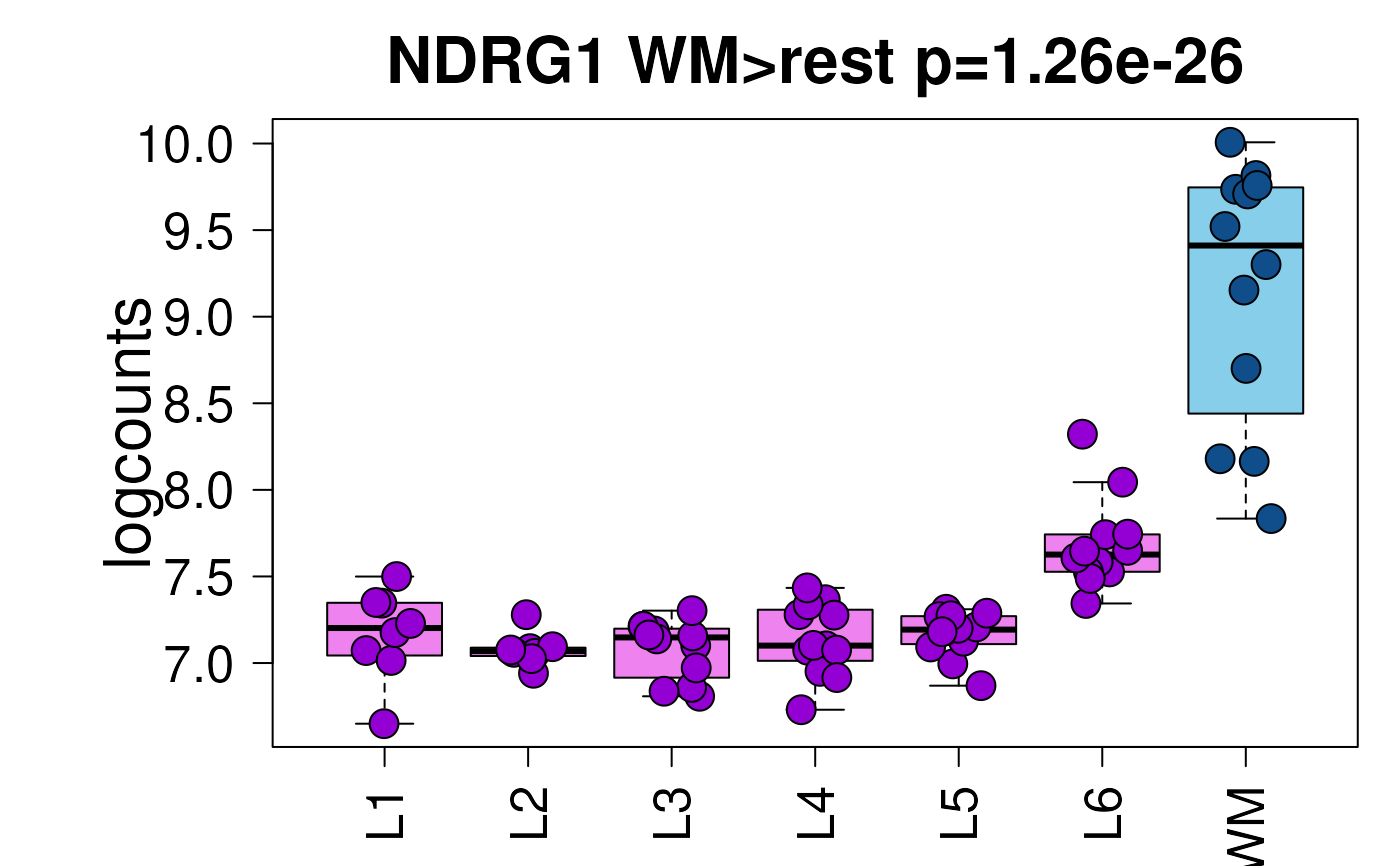
## Example default boxplot
set.seed(20200206)
layer_boxplot(sig_genes = sig_genes, sce_layer = sce_layer)
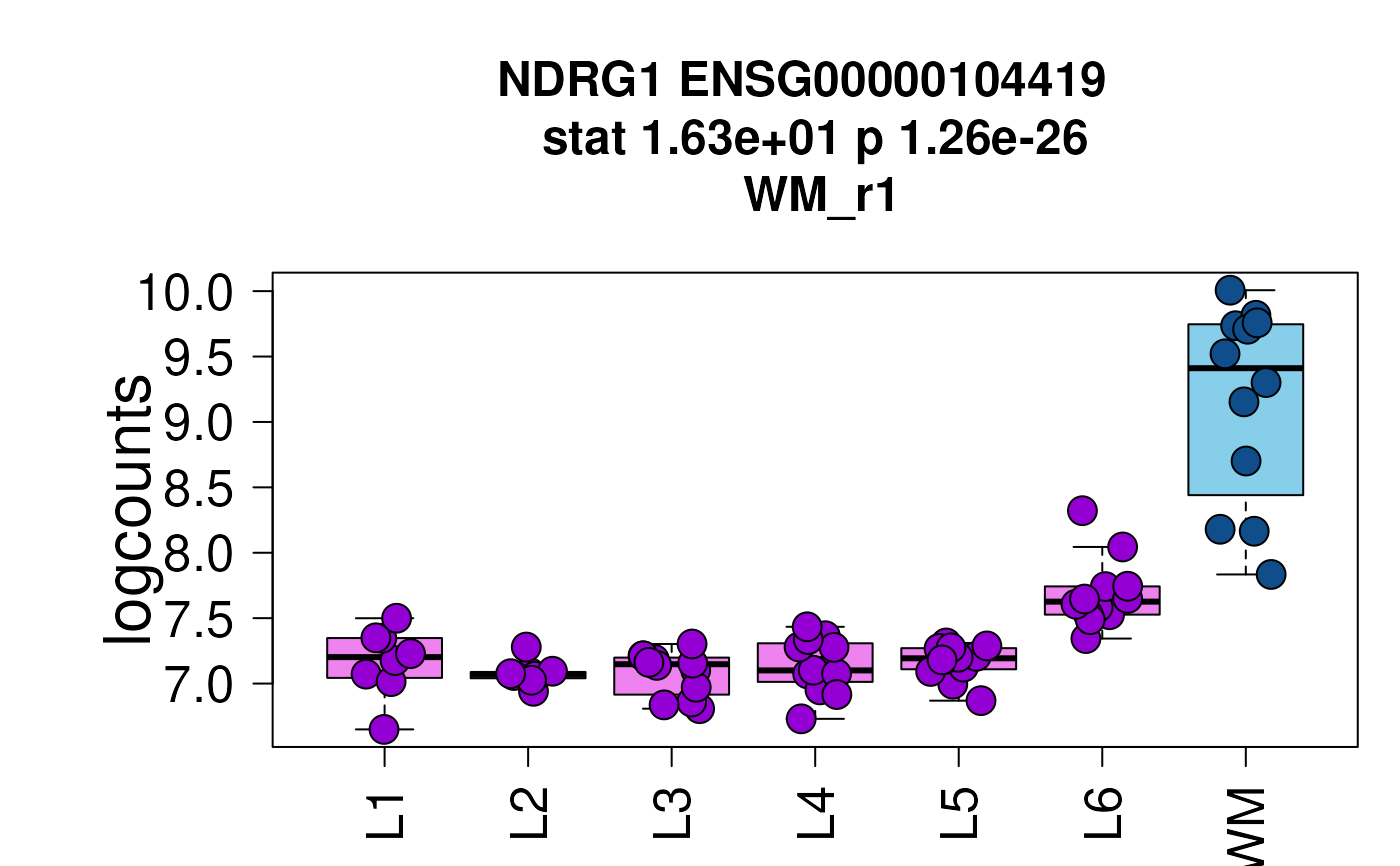
 ## Now show the long title version
set.seed(20200206)
layer_boxplot(
sig_genes = sig_genes,
short_title = FALSE,
sce_layer = sce_layer
)
## Now show the long title version
set.seed(20200206)
layer_boxplot(
sig_genes = sig_genes,
short_title = FALSE,
sce_layer = sce_layer
)
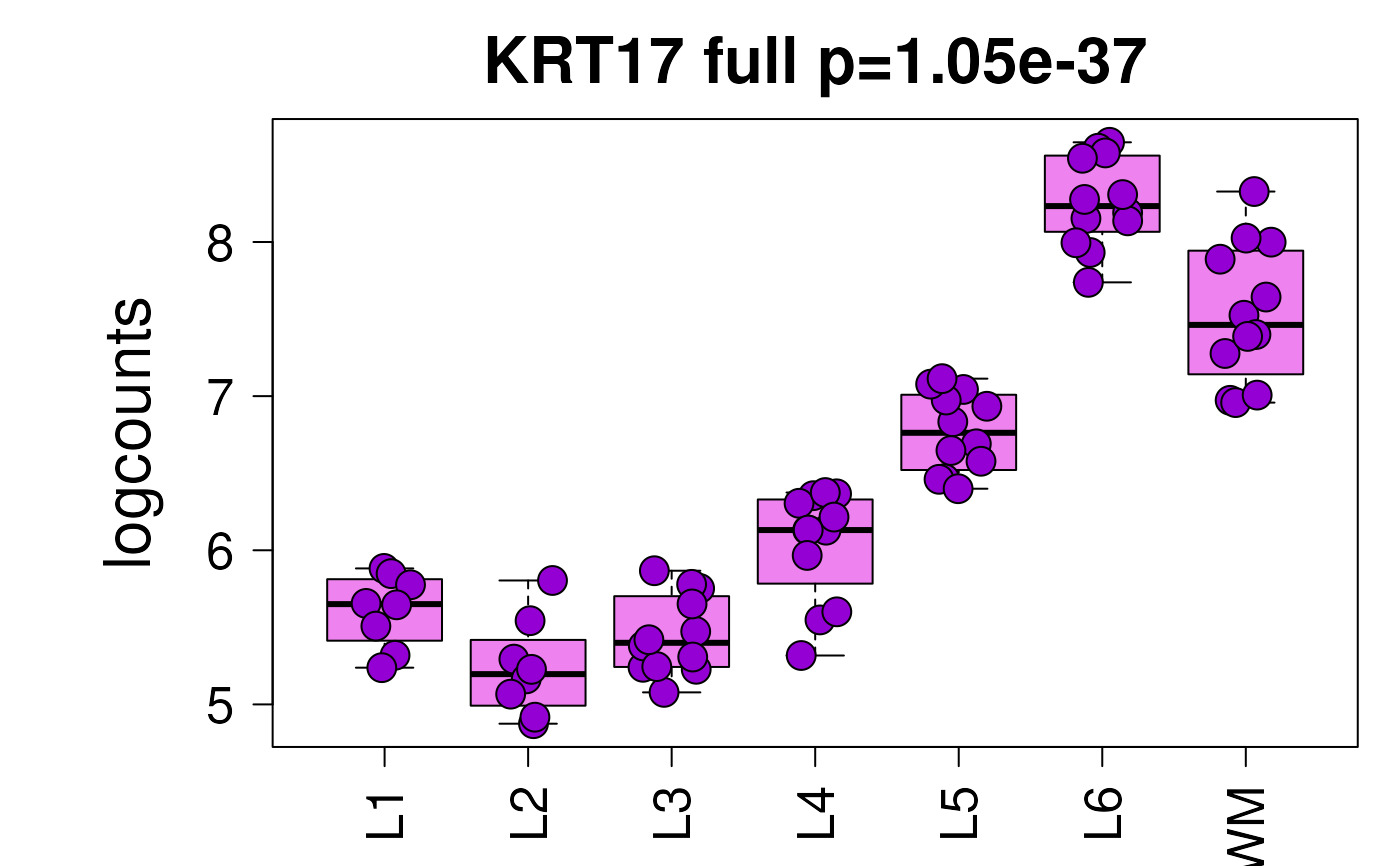
 set.seed(20200206)
layer_boxplot(
i = which(sig_genes$model_type == "anova")[1],
sig_genes = sig_genes,
sce_layer = sce_layer
)
set.seed(20200206)
layer_boxplot(
i = which(sig_genes$model_type == "anova")[1],
sig_genes = sig_genes,
sce_layer = sce_layer
)
 set.seed(20200206)
layer_boxplot(
i = which(sig_genes$model_type == "pairwise")[1],
sig_genes = sig_genes,
sce_layer = sce_layer
)
set.seed(20200206)
layer_boxplot(
i = which(sig_genes$model_type == "pairwise")[1],
sig_genes = sig_genes,
sce_layer = sce_layer
)
 ## Viridis colors displayed in the shiny app
library("viridisLite")
set.seed(20200206)
layer_boxplot(
sig_genes = sig_genes,
sce_layer = sce_layer,
col_low_box = viridis(4)[2],
col_low_point = viridis(4)[1],
col_high_box = viridis(4)[3],
col_high_point = viridis(4)[4]
)
## Viridis colors displayed in the shiny app
library("viridisLite")
set.seed(20200206)
layer_boxplot(
sig_genes = sig_genes,
sce_layer = sce_layer,
col_low_box = viridis(4)[2],
col_low_point = viridis(4)[1],
col_high_box = viridis(4)[3],
col_high_point = viridis(4)[4]
)
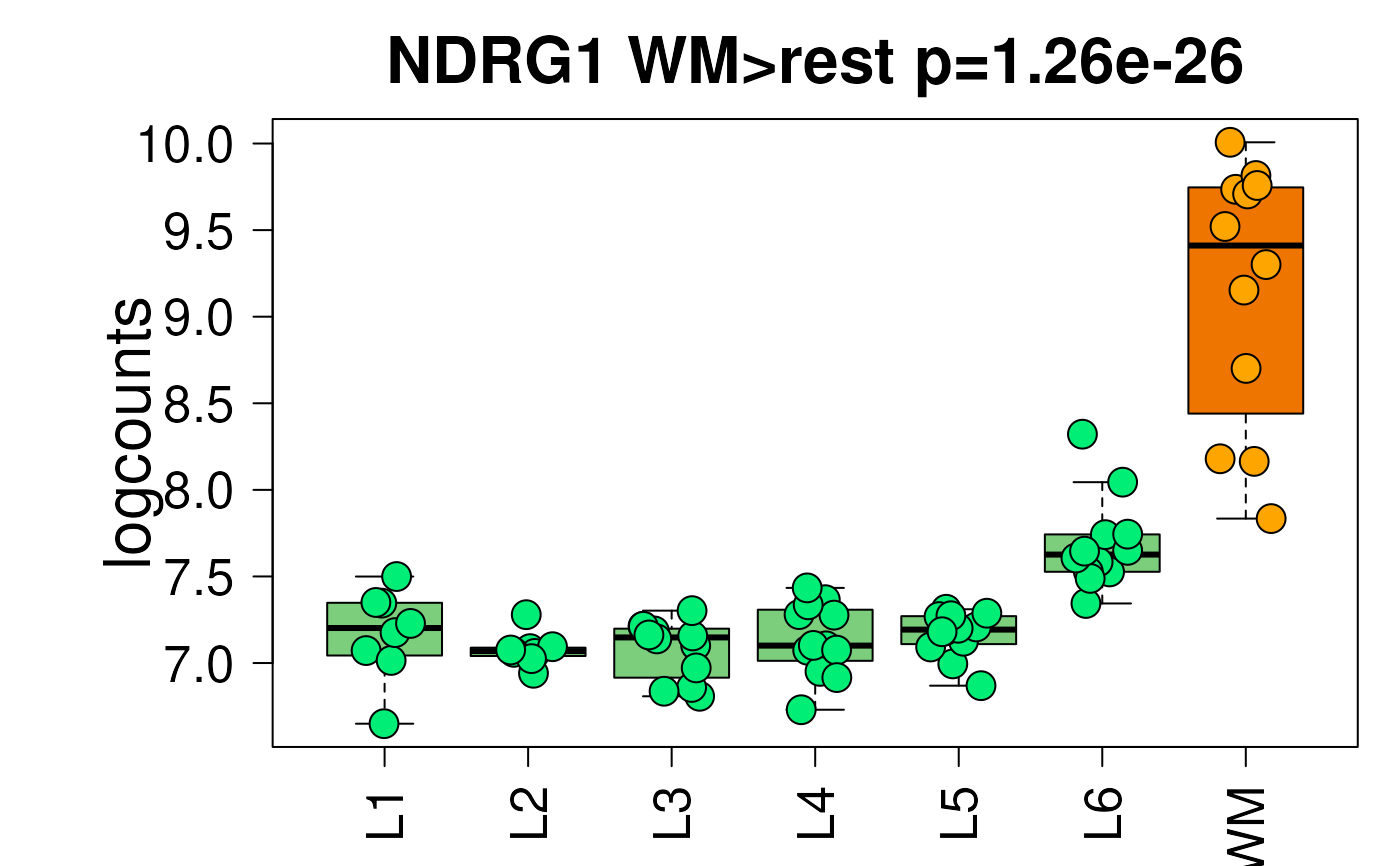
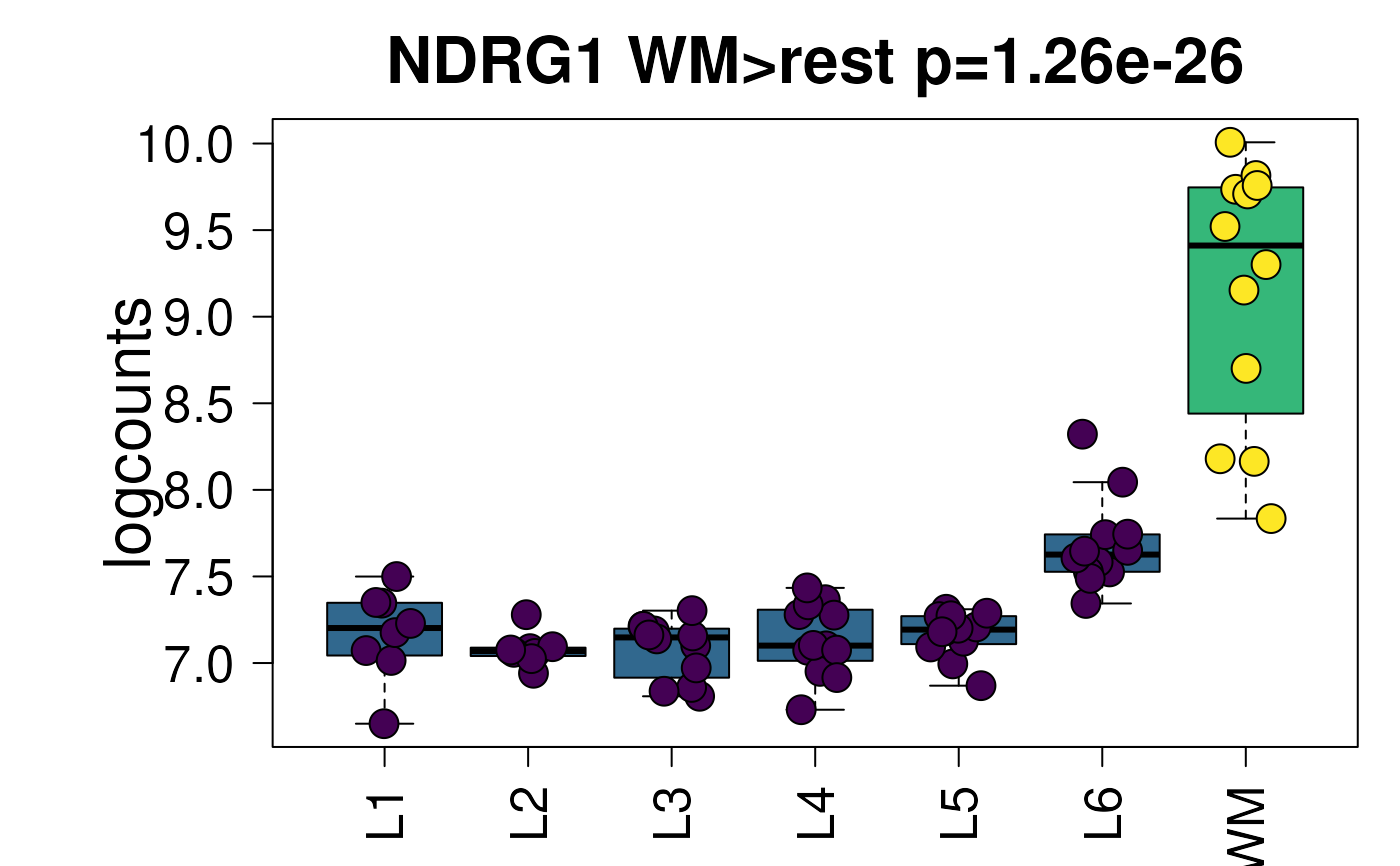 ## Paper colors displayed in the shiny app
set.seed(20200206)
layer_boxplot(
sig_genes = sig_genes,
sce_layer = sce_layer,
col_low_box = "palegreen3",
col_low_point = "springgreen2",
col_high_box = "darkorange2",
col_high_point = "orange1"
)
## Paper colors displayed in the shiny app
set.seed(20200206)
layer_boxplot(
sig_genes = sig_genes,
sce_layer = sce_layer,
col_low_box = "palegreen3",
col_low_point = "springgreen2",
col_high_box = "darkorange2",
col_high_point = "orange1"
)
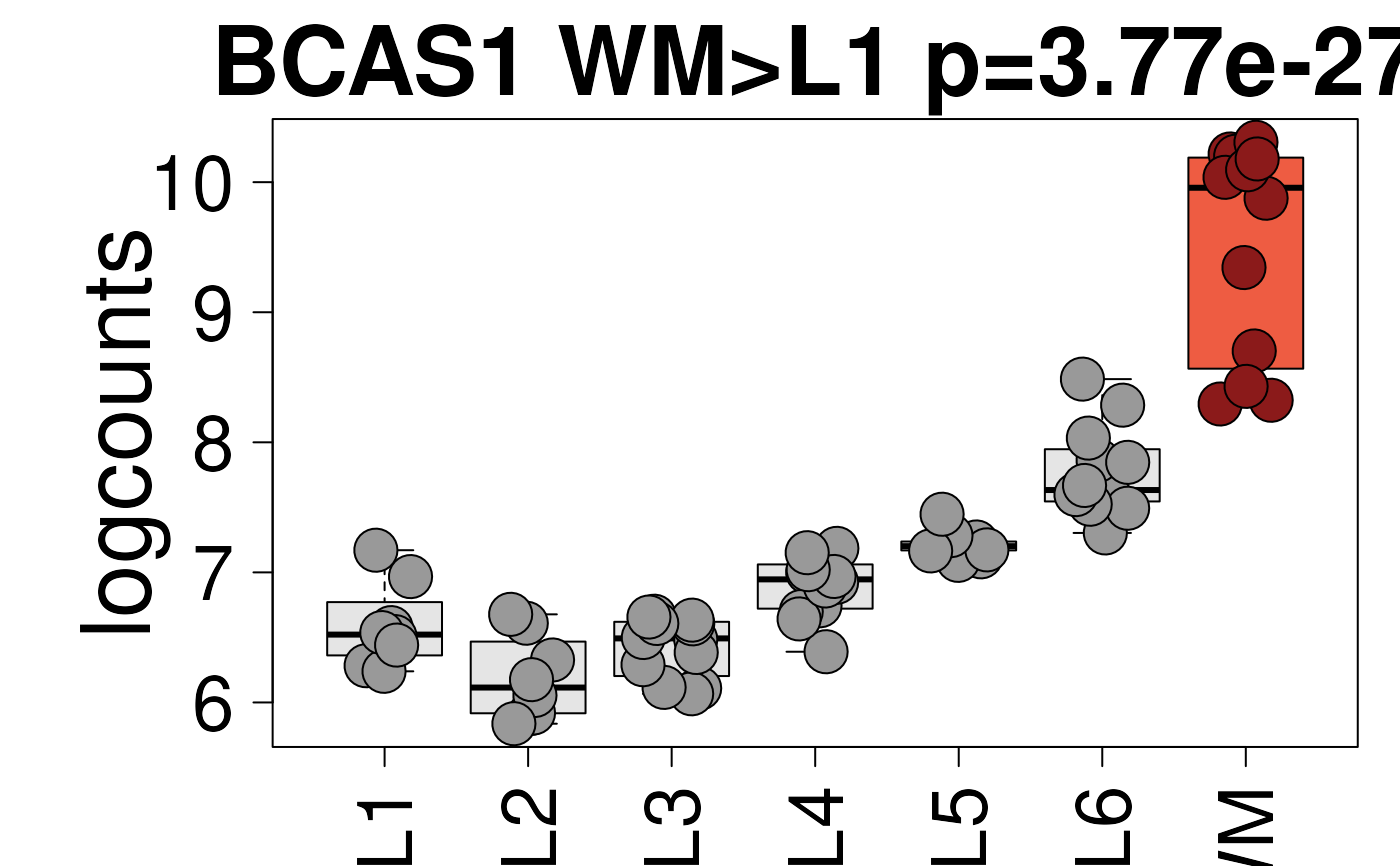
 ## Blue/red colors displayed in the shiny app
set.seed(20200206)
layer_boxplot(
i = which(sig_genes$model_type == "pairwise")[1],
sig_genes = sig_genes,
sce_layer = sce_layer,
col_bkg_box = "grey90",
col_bkg_point = "grey60",
col_low_box = "skyblue2",
col_low_point = "royalblue3",
col_high_box = "tomato2",
col_high_point = "firebrick4",
cex = 3
)
## Blue/red colors displayed in the shiny app
set.seed(20200206)
layer_boxplot(
i = which(sig_genes$model_type == "pairwise")[1],
sig_genes = sig_genes,
sce_layer = sce_layer,
col_bkg_box = "grey90",
col_bkg_point = "grey60",
col_low_box = "skyblue2",
col_low_point = "royalblue3",
col_high_box = "tomato2",
col_high_point = "firebrick4",
cex = 3
)