Visualize the correlation of layer modeling t-statistics with ComplexHeatmap
Source:R/layer_stat_cor_plot.R
layer_stat_cor_plot.RdThis function makes a ComplexHeatmap from the correlation matrix
between a reference and query modeling statistics from layer_stat_cor().
For example, between the query statistics from a set of cell cluster/types
derived from scRNA-seq or snRNA-seq data (among other types) and the
reference layer statistics from the Human DLPFC Visium data (when using the
default arguments).
layer_stat_cor_plot(
  cor_stats_layer,
  color_max = max(cor_stats_layer),
  color_min = min(cor_stats_layer),
  color_scale = RColorBrewer::brewer.pal(7, "PRGn"),
  query_colors = NULL,
  reference_colors = NULL,
  annotation = NULL,
  ...
)
Arguments
- cor_stats_layer
The output of
layer_stat_cor().- color_max
A
numeric(1)specifying the highest correlation value for the color scale (should be between 0 and 1).- color_min
A
numeric(1)specifying the lowest correlation value for the color scale (should be between 0 and -1).- color_scale
A
charactervector with three or more values specifying the color scale for the fill of the heatmap. The first value is used forcolor_min, the middle for zero, and the last forcolor_max. If an even number of colors are supplied, the last color is dropped to center zero.- query_colors
named
charactervector of colors, Adds colors to query row annotations.- reference_colors
named
charactervector of colors, Adds colors to reference column annotations.- annotation
annotation data.frame output of
annotate_registered_clusters(), adds 'X' for good confidence annotations, '*' for poor confidence.- ...
Additional parameters passed to
ComplexHeatmap::Heatmap()such ascluster_rowsandcluster_columns.
Value
(Heatmap-class) plot of t-stat correlations
Details
Includes functionality to add color annotations,
(helpful to match to colors in Visium spot plots), and annotations from
annotate_registered_clusters().
See also
Other Layer correlation functions:
annotate_registered_clusters(),
layer_stat_cor()
Examples
## Obtain the necessary data
## reference human pilot modeling results
if (!exists("modeling_results")) {
modeling_results <- fetch_data(type = "modeling_results")
}
#> 2026-03-27 00:06:49.935609 loading file /github/home/.cache/R/BiocFileCache/f2e71d5f5d9_Human_DLPFC_Visium_modeling_results.Rdata%3Fdl%3D1
## query spatialDLPFC modeling results
query_modeling_results <- fetch_data(
type = "spatialDLPFC_Visium_modeling_results"
)
#> 2026-03-27 00:06:50.861225 loading file /github/home/.cache/R/BiocFileCache/1a6c34e77d9e_modeling_results_BayesSpace_k09.Rdata%3Fdl%3D1
## Compute the correlations
cor_stats_layer <- layer_stat_cor(
stats = query_modeling_results$enrichment,
modeling_results,
model_type = "enrichment"
)
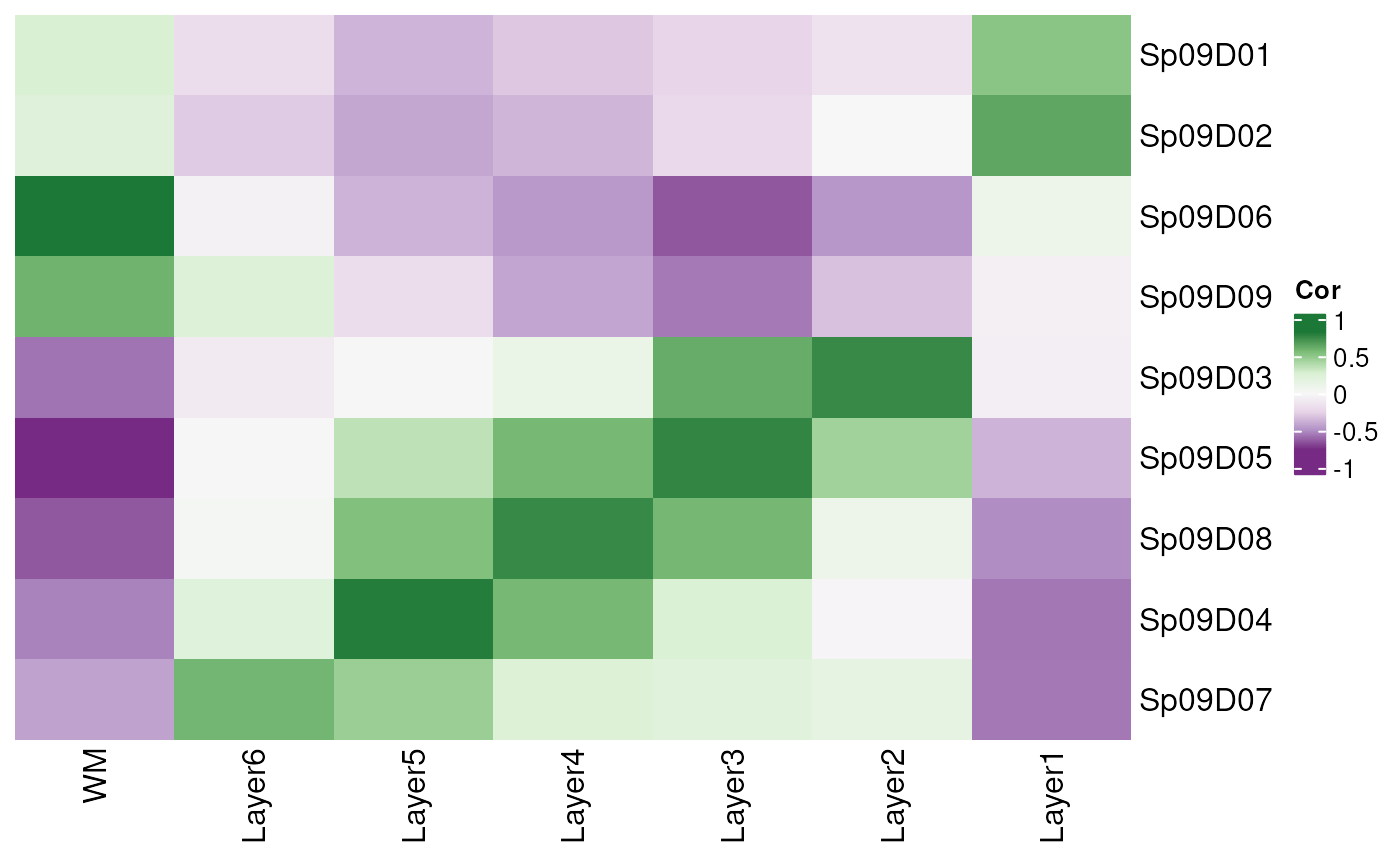
## Visualize the correlation matrix
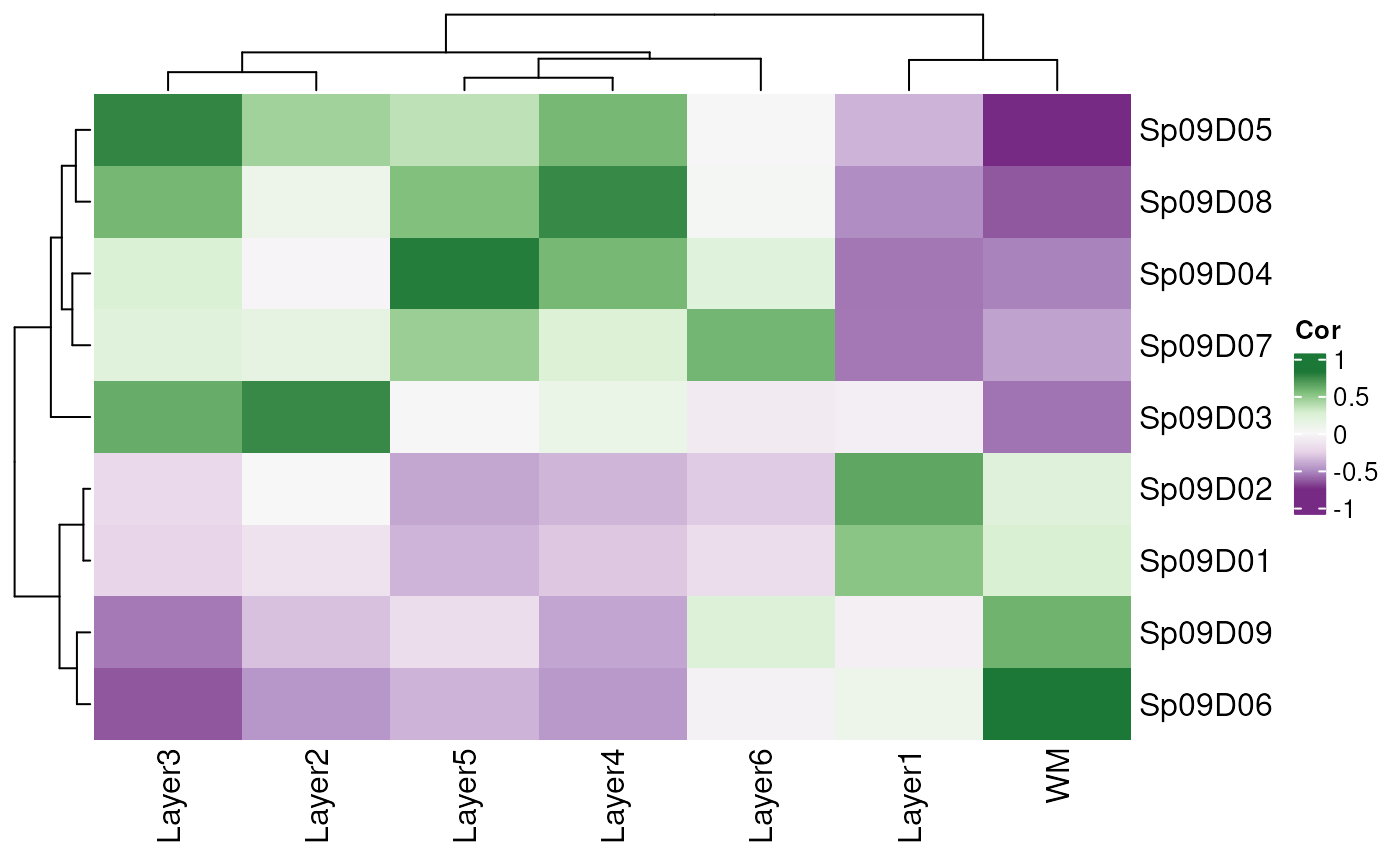
## Default plot with no annotations and defaults for ComplexHeatmap()
layer_stat_cor_plot(cor_stats_layer)
 ## add Annotation colors
## add libd_layer_colors to reference Human Pilot layers
layer_stat_cor_plot(cor_stats_layer, reference_colors = libd_layer_colors)
## add Annotation colors
## add libd_layer_colors to reference Human Pilot layers
layer_stat_cor_plot(cor_stats_layer, reference_colors = libd_layer_colors)
 ## obtain colors for the query clusters
cluster_colors <- get_colors(clusters = rownames(cor_stats_layer))
layer_stat_cor_plot(cor_stats_layer,
query_colors = cluster_colors,
reference_colors = libd_layer_colors
)
## obtain colors for the query clusters
cluster_colors <- get_colors(clusters = rownames(cor_stats_layer))
layer_stat_cor_plot(cor_stats_layer,
query_colors = cluster_colors,
reference_colors = libd_layer_colors
)
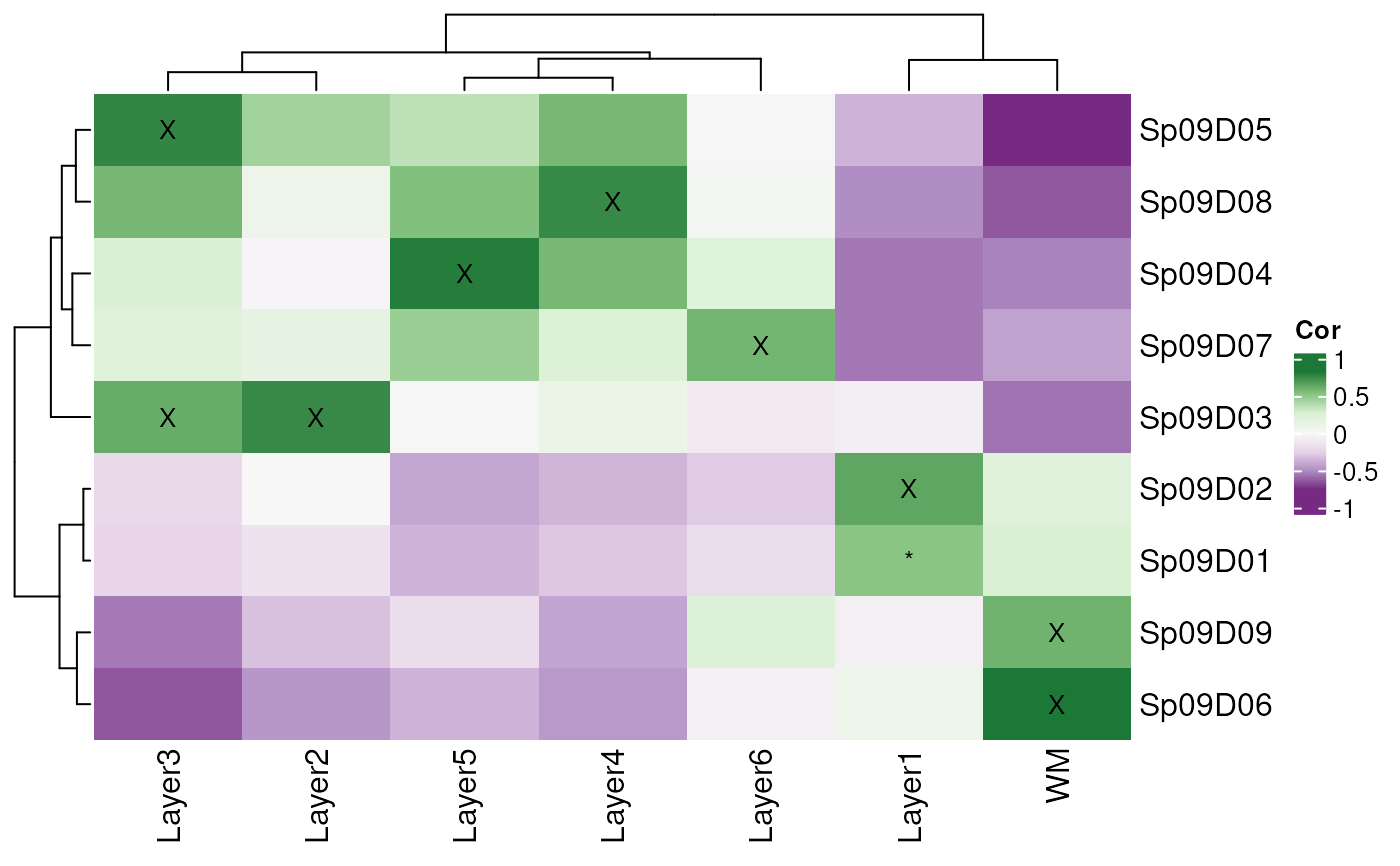
 ## Apply additional ComplexHeatmap param
layer_stat_cor_plot(cor_stats_layer,
cluster_rows = FALSE,
cluster_columns = FALSE
)
## Apply additional ComplexHeatmap param
layer_stat_cor_plot(cor_stats_layer,
cluster_rows = FALSE,
cluster_columns = FALSE
)
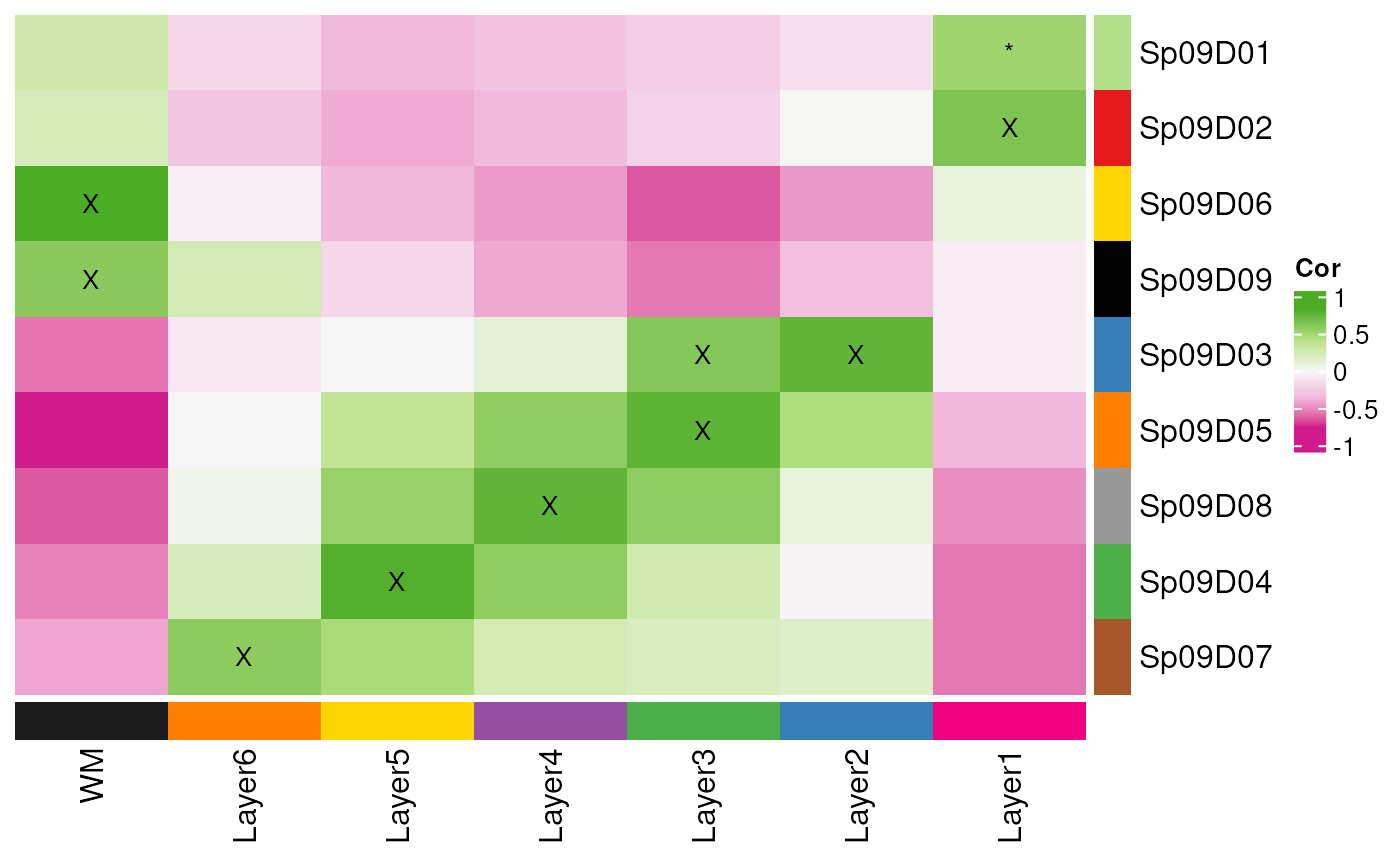
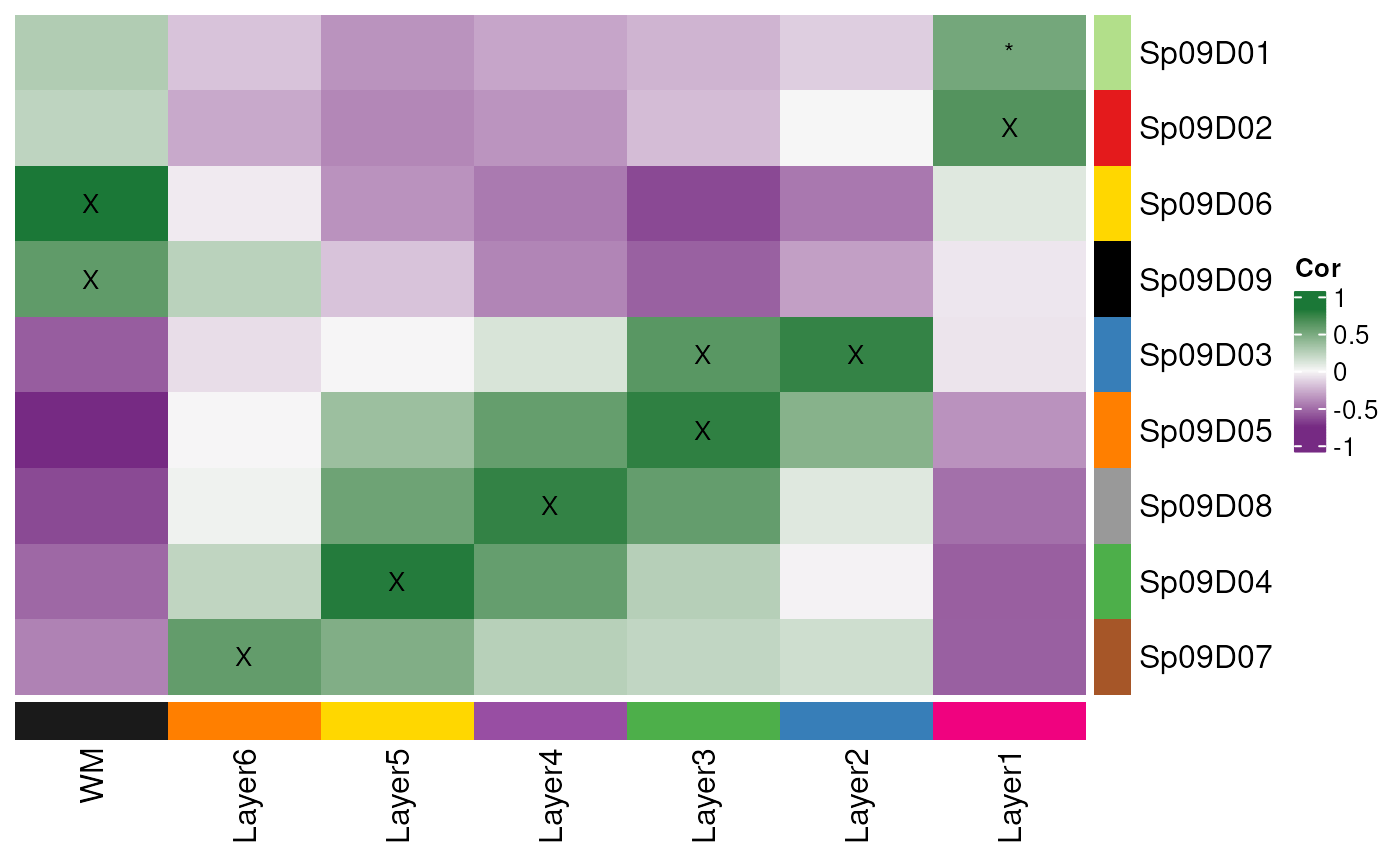
 ## Add annotation
annotation_df <- annotate_registered_clusters(
cor_stats_layer,
confidence_threshold = .55
)
layer_stat_cor_plot(cor_stats_layer, annotation = annotation_df)
## Add annotation
annotation_df <- annotate_registered_clusters(
cor_stats_layer,
confidence_threshold = .55
)
layer_stat_cor_plot(cor_stats_layer, annotation = annotation_df)
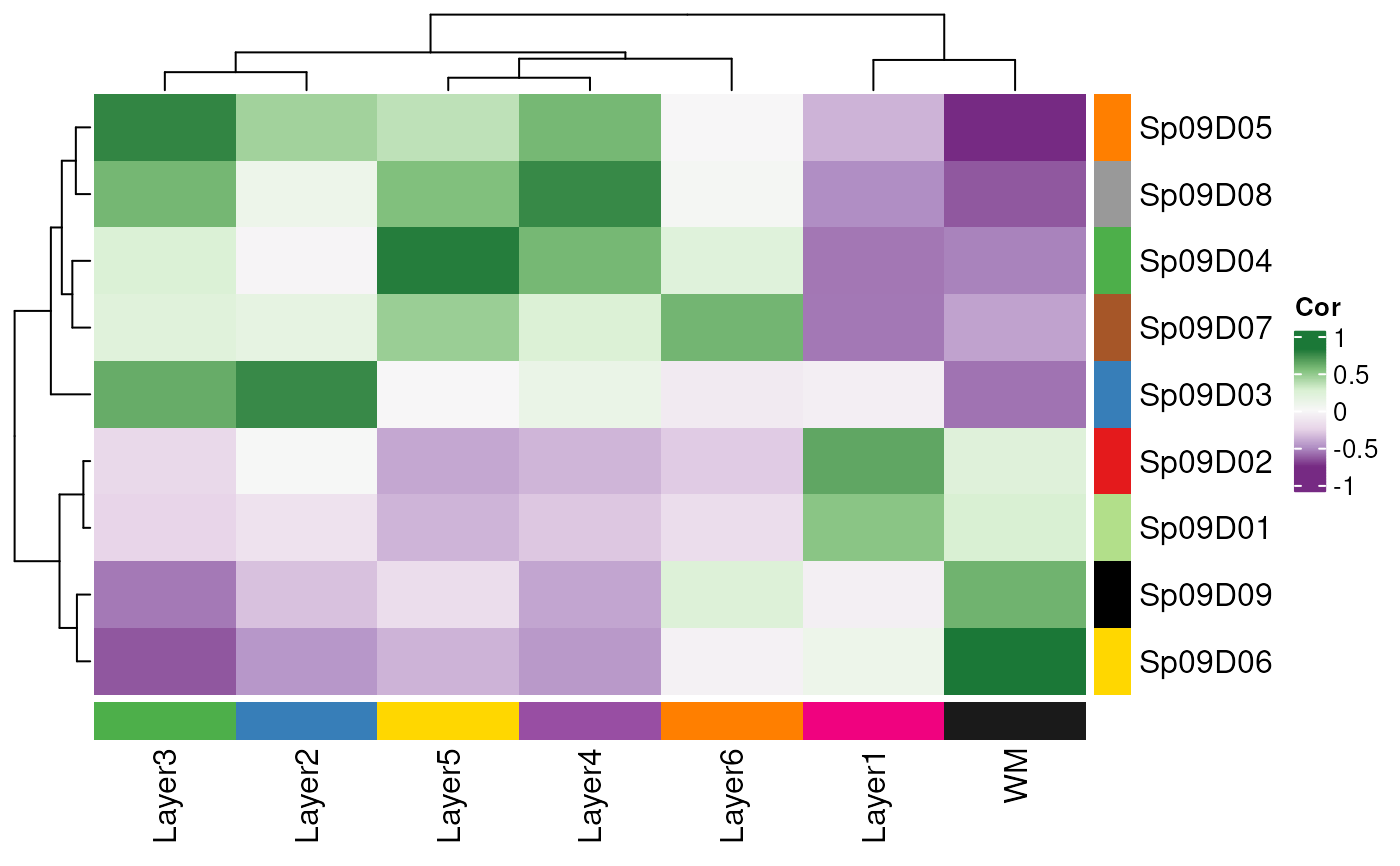
 ## change fill color scale
layer_stat_cor_plot(cor_stats_layer,
color_scale = RColorBrewer::brewer.pal(2, "PiYG")
)
#> Warning: minimal value for n is 3, returning requested palette with 3 different levels
## change fill color scale
layer_stat_cor_plot(cor_stats_layer,
color_scale = RColorBrewer::brewer.pal(2, "PiYG")
)
#> Warning: minimal value for n is 3, returning requested palette with 3 different levels
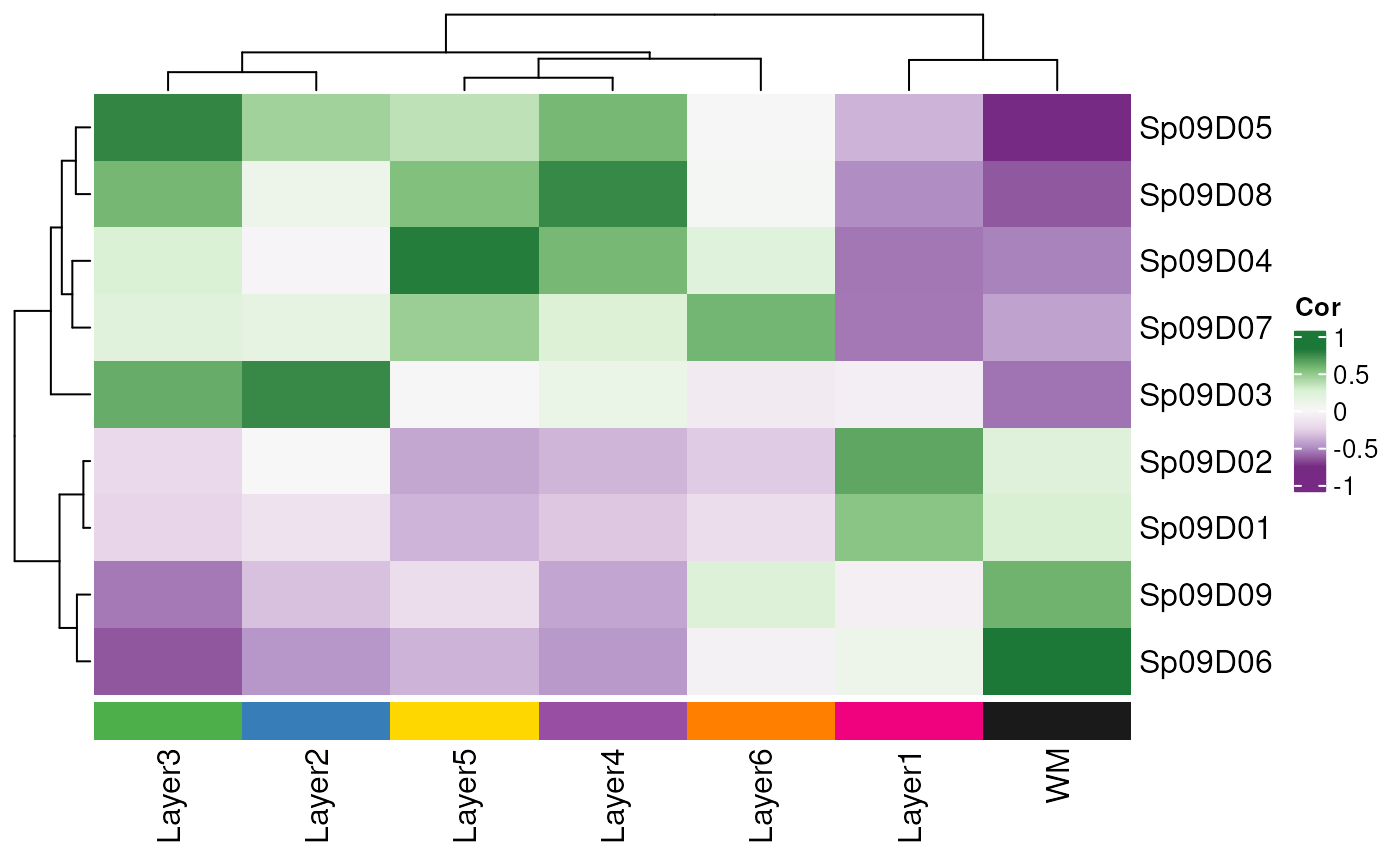
 ## All together
layer_stat_cor_plot(
cor_stats_layer,
color_scale = RColorBrewer::brewer.pal(5, "PiYG"),
query_colors = cluster_colors,
reference_colors = libd_layer_colors,
annotation = annotation_df,
cluster_rows = FALSE,
cluster_columns = FALSE
)
## All together
layer_stat_cor_plot(
cor_stats_layer,
color_scale = RColorBrewer::brewer.pal(5, "PiYG"),
query_colors = cluster_colors,
reference_colors = libd_layer_colors,
annotation = annotation_df,
cluster_rows = FALSE,
cluster_columns = FALSE
)