Quality Surrogate Variable Analysis
By Amy Peterson
Studying genetic differential expression using postmortem human brain tissue requires an understanding of the effect brain tissue degradation has on genetic expression. Particularly when brain tissue degradation confounds1 the differences in gene expression levels between subject groups. This problem of confounding necessitates measures from a control dataset of postmortem tissue from individuals who do not have the outcome of interest. Doing so provides a comparative measure of the impact of tissue degradation on expression that can then be used in a case-control study to examine the impact of the outcome of interest on genetic expression. Incorporating the determinations of tissue degradation in control brains in an algorithm to assess the results of genetic differential expression in brains that have the outcome of interest leads to more accurate results and reduces the number of false positive genes that are incorrectly identified as differentially expressed between cases and controls.
SVA background
RNA-sequencing (RNA-seq) is a high-throughput method for quantifying gene expression levels that requires using high-quality RNA. The effect of RNA quality on detecting genetic differential expression accurately was previously addressed with surrogate variable analysis (SVA), which includes batch effects to address the issue of heterogeneity in expression studies (Leek and Storey, 2007). The problem of confounding requires a more robust approach to identifying genes that are differentially expressed.
qSVA
The quality surrogate variable analysis (qSVA) algorithmic framework, an extended version of SVA, was developed by Andrew Jaffe and colleagues (Jaffe, Tao, Norris, Kealhofer, et al., 2017) to provide a method for solving the issue of confounding by brain degradation. The qSVA framework reduces the number of false positive genes, since genes may be identified because RNA quality confounding is not controlled for adequately. This conservative approach uses stricter criteria and involves processing methods that are well established, applying expression cutoffs, avoiding potential batch effects, and adjusting for RNA quality degradation confounding using qSVA.
Datasets
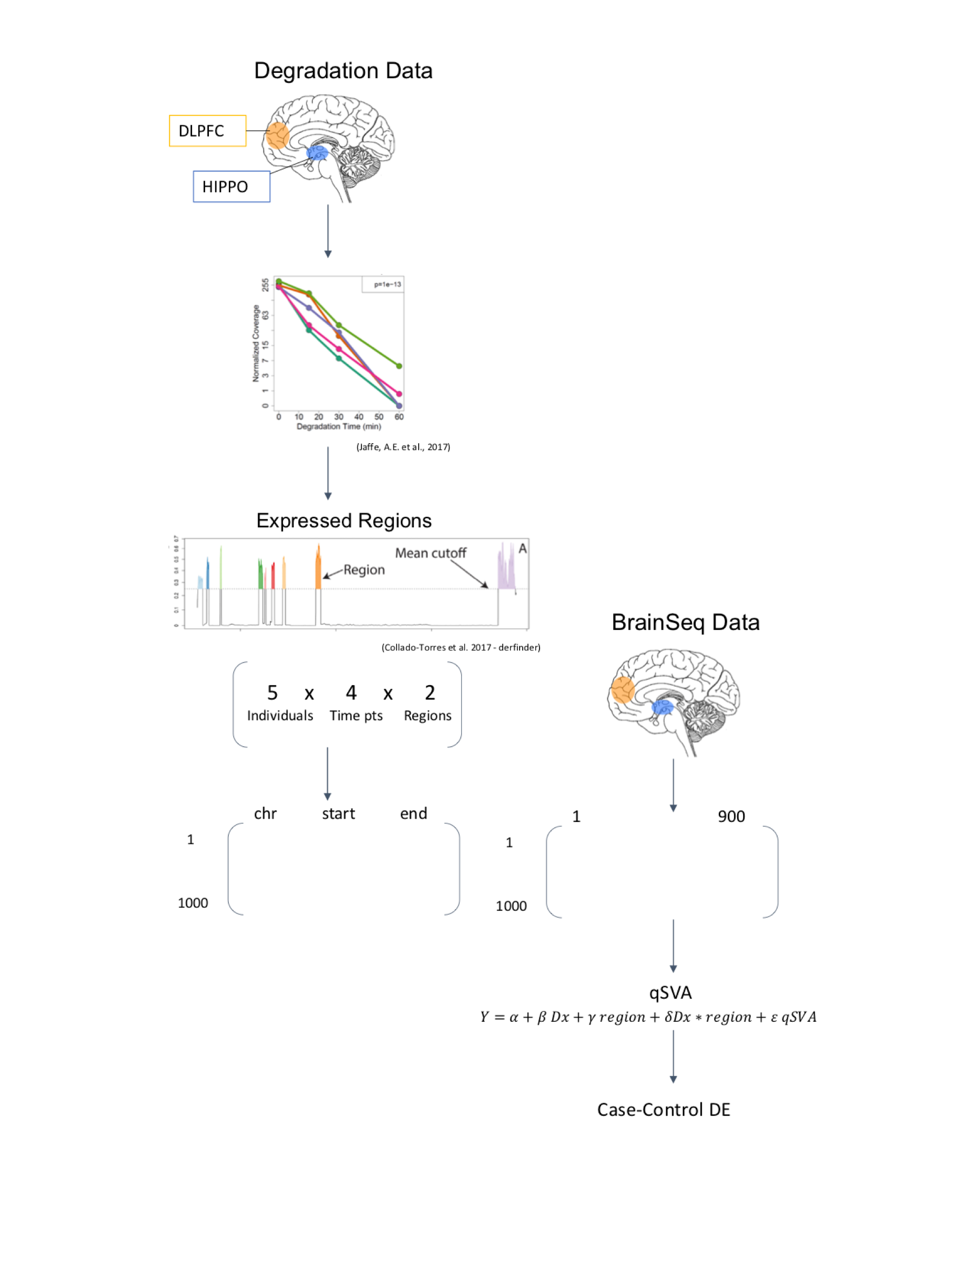
The qSVA algorithm requires the use of two datasets. Here, the dataset of interest is part of BrainSeq, A Human Brain Genomics Consortium, which was initiated with the goal of generating a public database of gene expression in postmortem brain tissue to enhance the understanding of psychiatric disorders through neurogenomic data (Schubert, O’Donnell, Quan, Wendland, et al., 2015). The other dataset is a control dataset, which can also be referred to as the degradation dataset, since it is the measure of the impact of degradation on gene expression in postmortem tissue for individuals who do not have the outcome of interest. The degradation dataset is a much smaller dataset and helps determine the genomic regions most associated with brain degradation. This addresses the concern of an association between the outcome of interest and genetic expression, and helps better understand metrics that demonstrate RNA quality through experimental approaches. Using these two datasets, and by extending qSVA to more than one brain region, we are able to examine the issue of RNA quality confounding using RNA-seq data from multiple brain regions in a case-control study comparing degradation of tissue in patients with schizophrenia to non-psychiatric controls using BrainSeq consortium data (Collado-Torres, Burke, Peterson, Shin, et al., 2018). We focused on the hippocampus (HIPPO) and dorsolateral prefrontal cortex (DLPFC), two brain regions that have been identified as functionally-altered in schizophrenia (Rasetti, Mattay, White, Sambataro, et al., 2014).
Algorithm and Workflow
The algorithm has terms that account for measured covariates, including diagnosis, age, sex, mitochondrial rate, rRNA rate, gene assignment rate, RNA integrity number (RIN), ethnicity principal components (PCs)2, and the region-specific quality surrogate variables, or qSVs, identified using the degradation dataset.
Results
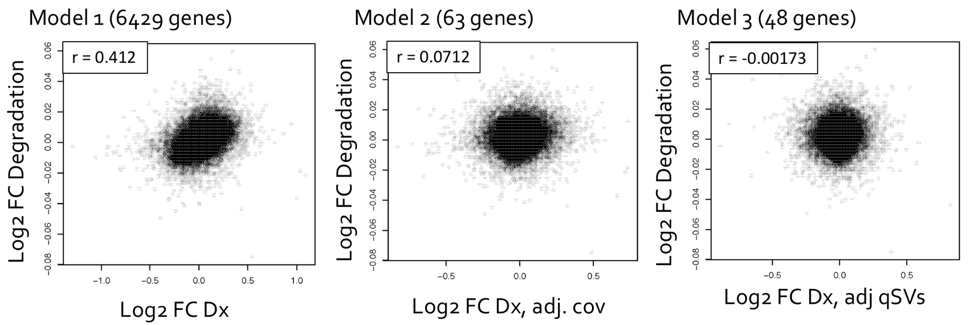
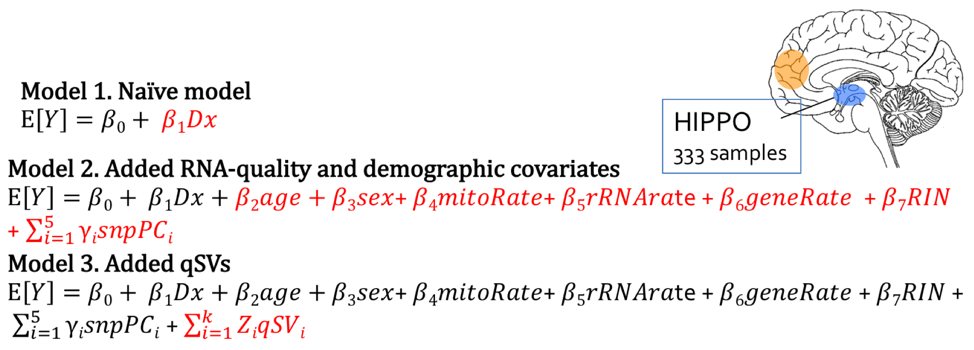
After using qSVA to adjust for the confounding effect of RNA, differential expression quality (DEqual) plots are used to assess the effectiveness of the statistical correction. These plots compare the differential expression statistics for the degradation data experiments on the y axis to statistics for the outcome from the dataset of interest on the x axis. The plots are shown for the HIPPO samples, looking at the log-fold change in expression per minute, with each point representing a gene. The goal is to assess the correlation between these two datasets, and how the correlation changes after including the quality surrogate variables (qSVs) in the model. There should not be correlation between the degradation dataset and the schizophrenia disorder case-control BrainSeq dataset, labeled as Dx on the axis for diagnosis, since they are independent datasets and the degradation dataset is serving as a control. Model 1 is a naïve model that includes diagnosis only. Model 2 includes diagnosis and measures for RNA-quality and demographic covariates. Model 3 includes all of the terms from the previous models, with the added qSVs. The number of genes identified as differentially expressed are shown in parentheses next to each model, and the number of genes identified as differentially expressed reduces drastically from over 6,000 in model 1, to 63 in model 2, to 48 in model 3.
Conclusions
Once we are confident that confounding has been removed from the samples of interest, we are able to assess differential expression between cases and controls. Using the 48 genes identified from model 3, we can then perform gene biological process ontology enrichment analysis to determine which genes show enrichment, and to gain clearer insights into which genes are most affected in brain tissue of individuals with schizophrenia. For more information please check the freely available pre-print describing the BrainSeq Phase II project (Collado-Torres, Burke, Peterson, Shin, et al., 2018).
Amy Peterson extended the qSVA statistical framework to from one to multiple brain regions as part of her JHBSPH MPH Capstone project that she carried out with Andrew E. Jaffe and Leonardo Collado-Torres at the Lieber Institute for Brain Development. The R and bash code Amy Peterson wrote is available online via GitHub at LieberInstitute/qsva_brain.
A few days late, but here's Amy https://t.co/A0OSUVD9Nw after successfully presenting her @JohnsHopkinsSPH MPH capstone project. It was a great experience for me to mentor her along with @andrewjaffe at @lieberinstitute I look forward to seeing where her career takes her 🙌🏾 ^^ pic.twitter.com/hbUiHQOVq3
— 🇲🇽 Leonardo Collado-Torres (@lcolladotor) May 8, 2018
Acknowledgments
This blog post was made possible thanks to:
References
[1] C. Boettiger. knitcitations: Citations for ‘Knitr’ Markdown Files. R package version 1.0.8. 2017. URL: https://CRAN.R-project.org/package=knitcitations.
[2] L. Collado-Torres, E. E. Burke, A. Peterson, J. H. Shin, et al. “Regional heterogeneity in gene expression, regulation and coherence in hippocampus and dorsolateral prefrontal cortex across development and in schizophrenia”. In: bioRxiv (2018). DOI: 10.1101/426213.
[3] G. Csárdi, R. core, H. Wickham, W. Chang, et al. sessioninfo: R Session Information. R package version 1.1.1. 2018. URL: https://CRAN.R-project.org/package=sessioninfo.
[4] A. E. Jaffe, R. Tao, A. L. Norris, M. Kealhofer, et al. “qSVA framework for RNA quality correction in differential expression analysis”. In: Proceedings of the National Academy of Sciences 114.27 (Jun. 2017), pp. 7130–7135. DOI: 10.1073/pnas.1617384114. URL: https://doi.org/10.1073/pnas.1617384114.
[5] J. T. Leek and J. D. Storey. “Capturing Heterogeneity in Gene Expression Studies by Surrogate Variable Analysis”. In: PLoS Genetics 3.9 (2007), p. e161. DOI: 10.1371/journal.pgen.0030161. URL: https://doi.org/10.1371/journal.pgen.0030161.
[6] A. Oleś, M. Morgan and W. Huber. BiocStyle: Standard styles for vignettes and other Bioconductor documents. R package version 2.10.0. 2018. URL: https://github.com/Bioconductor/BiocStyle.
[7] R. Rasetti, V. S. Mattay, M. G. White, F. Sambataro, et al. “Altered Hippocampal-Parahippocampal Function During Stimulus Encoding”. In: JAMA Psychiatry 71.3 (Mar. 2014), p. 236. DOI: 10.1001/jamapsychiatry.2013.3911. URL: https://doi.org/10.1001/jamapsychiatry.2013.3911.
[8] Schubert, O’Donnell, Quan, Wendland, et al. “BrainSeq: Neurogenomics to Drive Novel Target Discovery for Neuropsychiatric Disorders”. In: Neuron (2015). DOI: 10.1016/j.neuron.2015.10.047.
[9] Y. Xie, A. P. Hill and A. Thomas. blogdown: Creating Websites with R Markdown. ISBN 978-0815363729. Boca Raton, Florida: Chapman and Hall/CRC, 2017. URL: https://github.com/rstudio/blogdown.
Reproducibility
## ─ Session info ───────────────────────────────────────────────────────────────────────────────────────────────────────
##  setting  value
##  version  R version 3.5.1 (2018-07-02)
##  os       macOS Mojave 10.14.1
##  system   x86_64, darwin15.6.0
##  ui       X11
##  language (EN)
##  collate  en_US.UTF-8
##  ctype    en_US.UTF-8
##  tz       America/New_York
##  date     2018-12-11
##
## ─ Packages ───────────────────────────────────────────────────────────────────────────────────────────────────────────
##  package       * version date       lib source
##  assertthat      0.2.0   2017-04-11 [1] CRAN (R 3.5.0)
##  backports       1.1.2   2017-12-13 [1] CRAN (R 3.5.0)
##  bibtex          0.4.2   2017-06-30 [1] CRAN (R 3.5.0)
##  BiocManager     1.30.4  2018-11-13 [1] CRAN (R 3.5.0)
##  BiocStyle     * 2.10.0  2018-10-30 [1] Bioconductor
##  blogdown        0.9     2018-10-23 [1] CRAN (R 3.5.0)
##  bookdown        0.8     2018-12-03 [1] CRAN (R 3.5.0)
##  cli             1.0.1   2018-09-25 [1] CRAN (R 3.5.0)
##  colorout      * 1.2-0   2018-05-03 [1] Github (jalvesaq/colorout@c42088d)
##  crayon          1.3.4   2017-09-16 [1] CRAN (R 3.5.0)
##  curl            3.2     2018-03-28 [1] CRAN (R 3.5.0)
##  digest          0.6.18  2018-10-10 [1] CRAN (R 3.5.0)
##  evaluate        0.12    2018-10-09 [1] CRAN (R 3.5.0)
##  htmltools       0.3.6   2017-04-28 [1] CRAN (R 3.5.0)
##  httr            1.3.1   2017-08-20 [1] CRAN (R 3.5.0)
##  jsonlite        1.5     2017-06-01 [1] CRAN (R 3.5.0)
##  knitcitations * 1.0.8   2017-07-04 [1] CRAN (R 3.5.0)
##  knitr           1.20    2018-02-20 [1] CRAN (R 3.5.0)
##  lubridate       1.7.4   2018-04-11 [1] CRAN (R 3.5.0)
##  magrittr        1.5     2014-11-22 [1] CRAN (R 3.5.0)
##  plyr            1.8.4   2016-06-08 [1] CRAN (R 3.5.0)
##  R6              2.3.0   2018-10-04 [1] CRAN (R 3.5.0)
##  Rcpp            1.0.0   2018-11-07 [1] CRAN (R 3.5.0)
##  RefManageR      1.2.0   2018-04-25 [1] CRAN (R 3.5.0)
##  rmarkdown       1.10    2018-06-11 [1] CRAN (R 3.5.0)
##  rprojroot       1.3-2   2018-01-03 [1] CRAN (R 3.5.0)
##  sessioninfo   * 1.1.1   2018-11-05 [1] CRAN (R 3.5.0)
##  stringi         1.2.4   2018-07-20 [1] CRAN (R 3.5.0)
##  stringr         1.3.1   2018-05-10 [1] CRAN (R 3.5.0)
##  withr           2.1.2   2018-03-15 [1] CRAN (R 3.5.0)
##  xfun            0.4     2018-10-23 [1] CRAN (R 3.5.0)
##  xml2            1.2.0   2018-01-24 [1] CRAN (R 3.5.0)
##  yaml            2.2.0   2018-07-25 [1] CRAN (R 3.5.0)
##
## [1] /Library/Frameworks/R.framework/Versions/3.5devel/Resources/library
As defined in Wikipedia, confounding is: “In statistics, a confounder (also confounding variable, confounding factor or lurking variable) is a variable that influences both the dependent variable and independent variable causing a spurious association. Confounding is a causal concept, and as such, cannot be described in terms of correlations or associations.”↩
These are PCs computed on the genotype information from the individuals in this study. We use them to adjust for ethnicity in a more rigorous form than a categorical race variable would be able to do.↩