This function identify spots in a
SpatialExperiment-class (SPE)
with outlier quality control values: low sum_umi or sum_gene, or high
expr_chrM_ratio, utilizing scuttle::isOutlier. Also identifies in-tissue
edge spots and distance to the edge for each spot.
add_qc_metrics(spe, overwrite = FALSE)Arguments
- spe
a SpatialExperiment object that has
sum_umi,sum_gene,expr_chrM_ratio, andin_tissuevariables in thecolData(spe). Note that these are automatically created when you build yourspeobject withspatialLIBD::read10xVisiumWrapper().- overwrite
a
logical(1)specifying whether to overwrite the 7colData(spe)columns that this function creates. If set toFALSEand any of them are present, the function will return an error.
Value
A SpatialExperiment
with added quality control information added to the colData().
scran_low_lib_sizeshows spots that have a low library size.
scran_low_n_featuresspots with a low number of expressed genes.
scran_high_Mito_percentspots with a high percent of mitochondrial gene expression.
scran_discardspots belonging to either
scran_low_lib_size,scran_low_n_feature, orscran_high_Mito_percent.edge_spotspots that are automatically detected as the edge spots of the
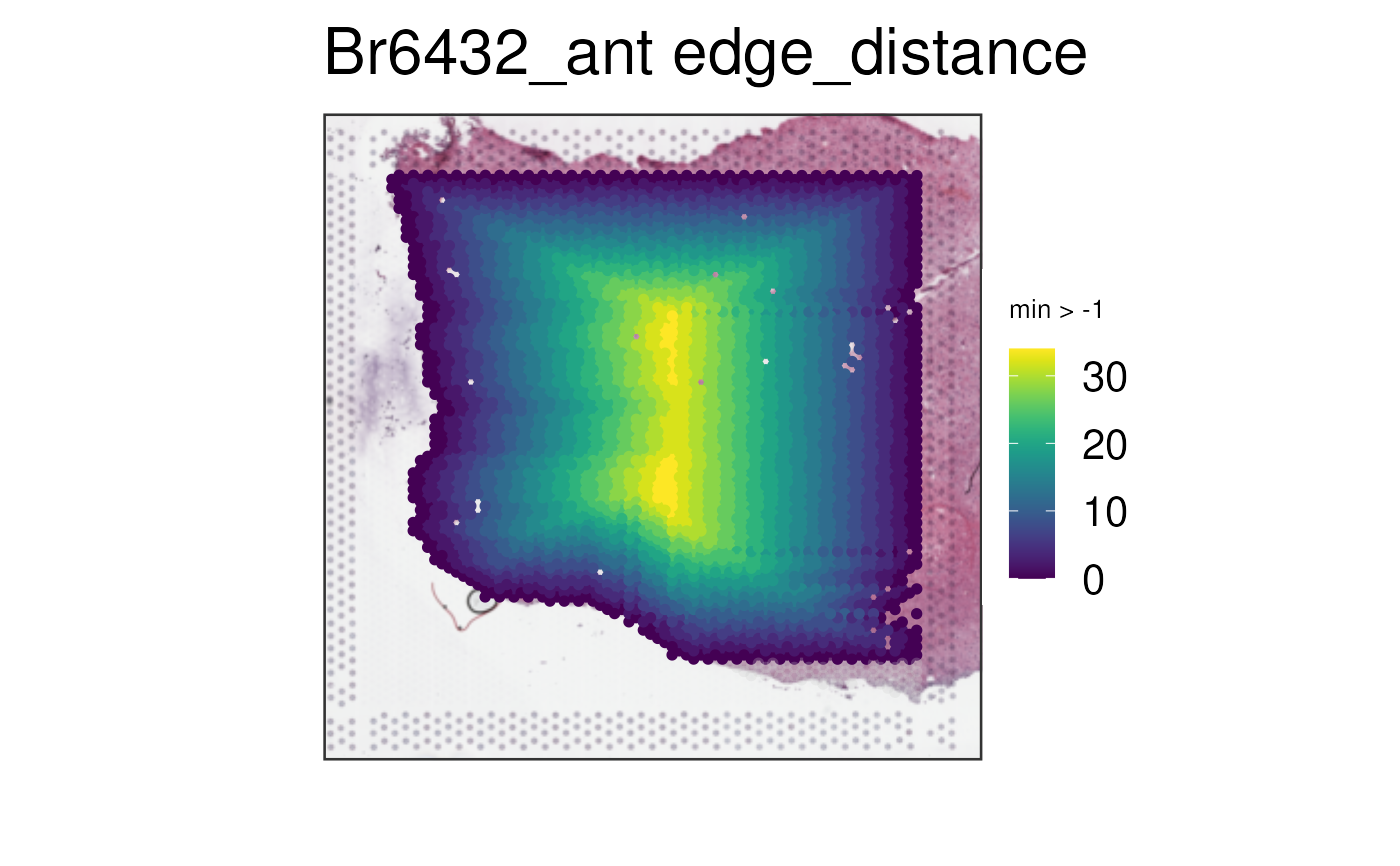
in_tissuesection.edge_distanceclosest distance in number of spots to either the vertical or horizontal edge.
scran_low_lib_size_edgespots that have a low library size and are an edge spot.
Details
The initial version of this function lives at https://github.com/LieberInstitute/Visium_SPG_AD/blob/master/code/07_spot_qc/01_qc_metrics_and_segmentation.R.
Examples
## Obtain the necessary data
spe_pre_qc <- fetch_data("spatialDLPFC_Visium_example_subset")
#> 2026-03-27 00:04:47.525376 loading file /github/home/.cache/R/BiocFileCache/f2e4f8682d9_spatialDLPFC_spe_subset_example.rds%3Fdl%3D1
## For now, we fake out tissue spots in example data
spe_qc <- spe_pre_qc
spe_qc$in_tissue[spe_qc$array_col < 10] <- FALSE
## adds QC metrics to colData of the spe
spe_qc <- add_qc_metrics(spe_qc, overwrite = TRUE)
vars <- colnames(colData(spe_qc))
vars[grep("^(scran|edge)", vars)]
#> [1] "scran_discard" "scran_high_subsets_Mito_percent"
#> [3] "scran_low_lib_size" "scran_low_n_features"
#> [5] "scran_quick_cluster" "scran_high_Mito_percent"
#> [7] "edge_spot" "edge_distance"
#> [9] "scran_low_lib_size_edge"
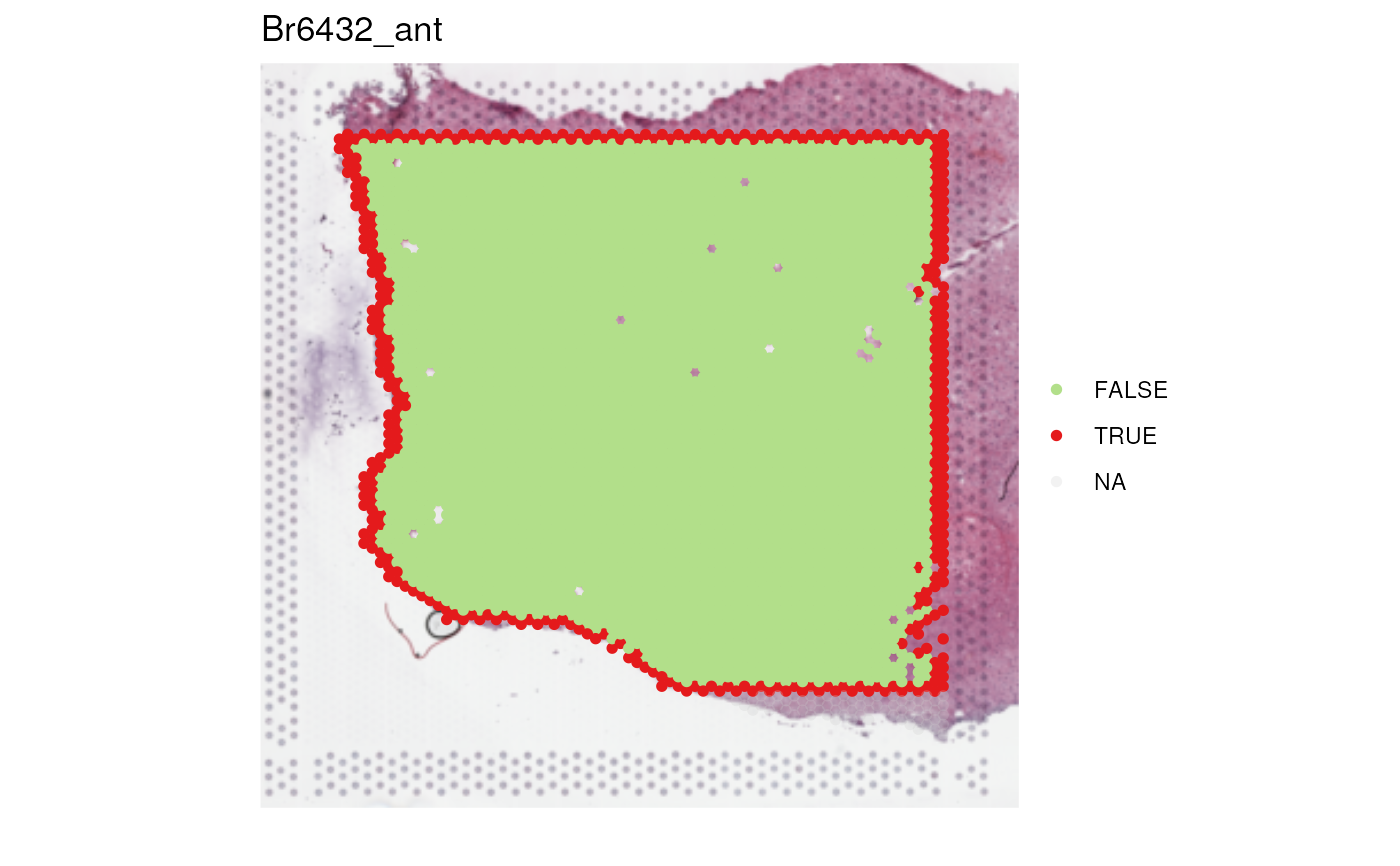
## visualize edge spots
vis_clus(spe_qc, sampleid = "Br6432_ant", clustervar = "edge_spot")
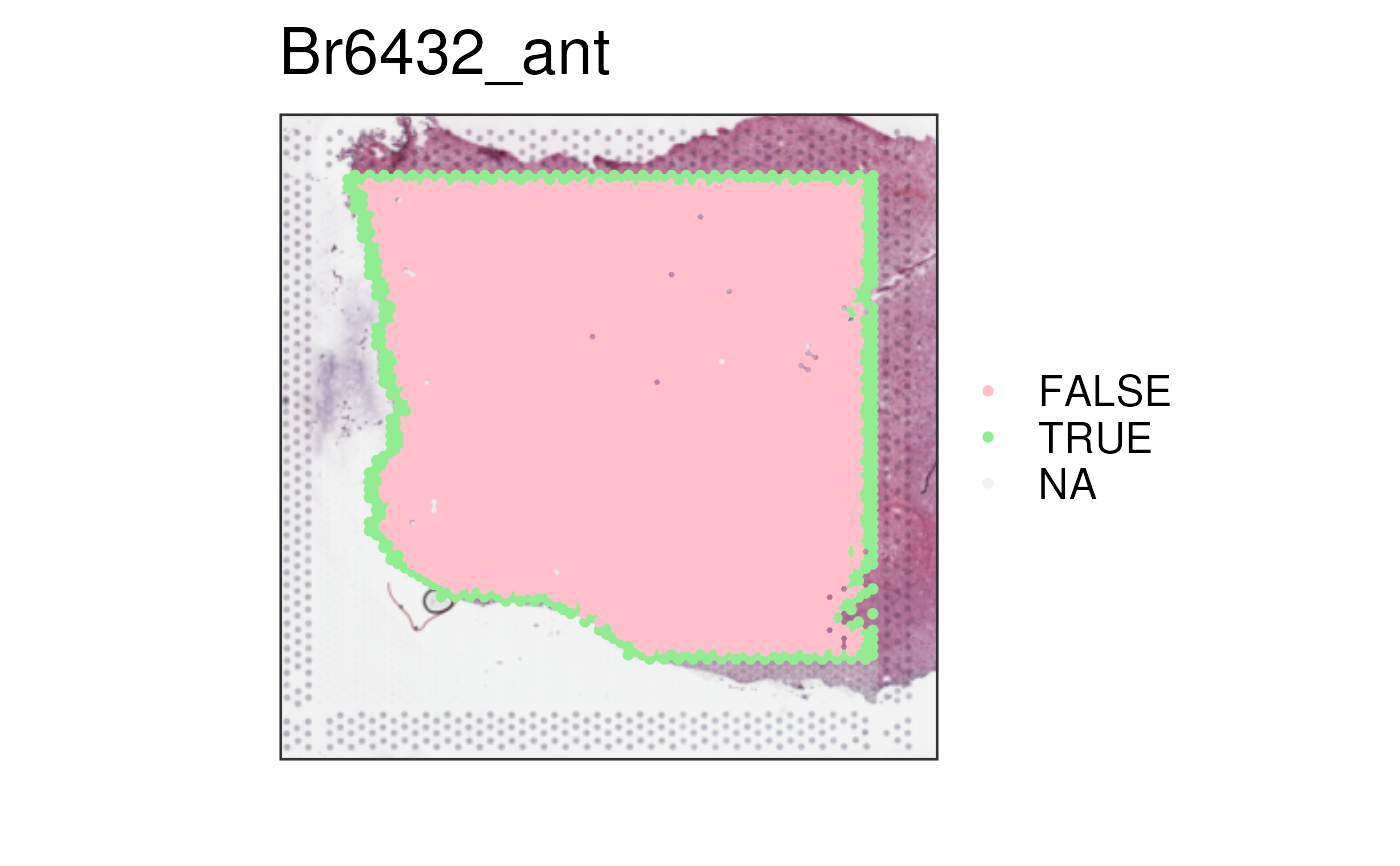
 ## specify your own colors
vis_clus(
spe_qc,
sampleid = "Br6432_ant",
clustervar = "edge_spot",
colors = c(
"TRUE" = "lightgreen",
"FALSE" = "pink",
"NA" = "red"
)
)
## specify your own colors
vis_clus(
spe_qc,
sampleid = "Br6432_ant",
clustervar = "edge_spot",
colors = c(
"TRUE" = "lightgreen",
"FALSE" = "pink",
"NA" = "red"
)
)
 vis_gene(spe_qc, sampleid = "Br6432_ant", geneid = "edge_distance", minCount = -1)
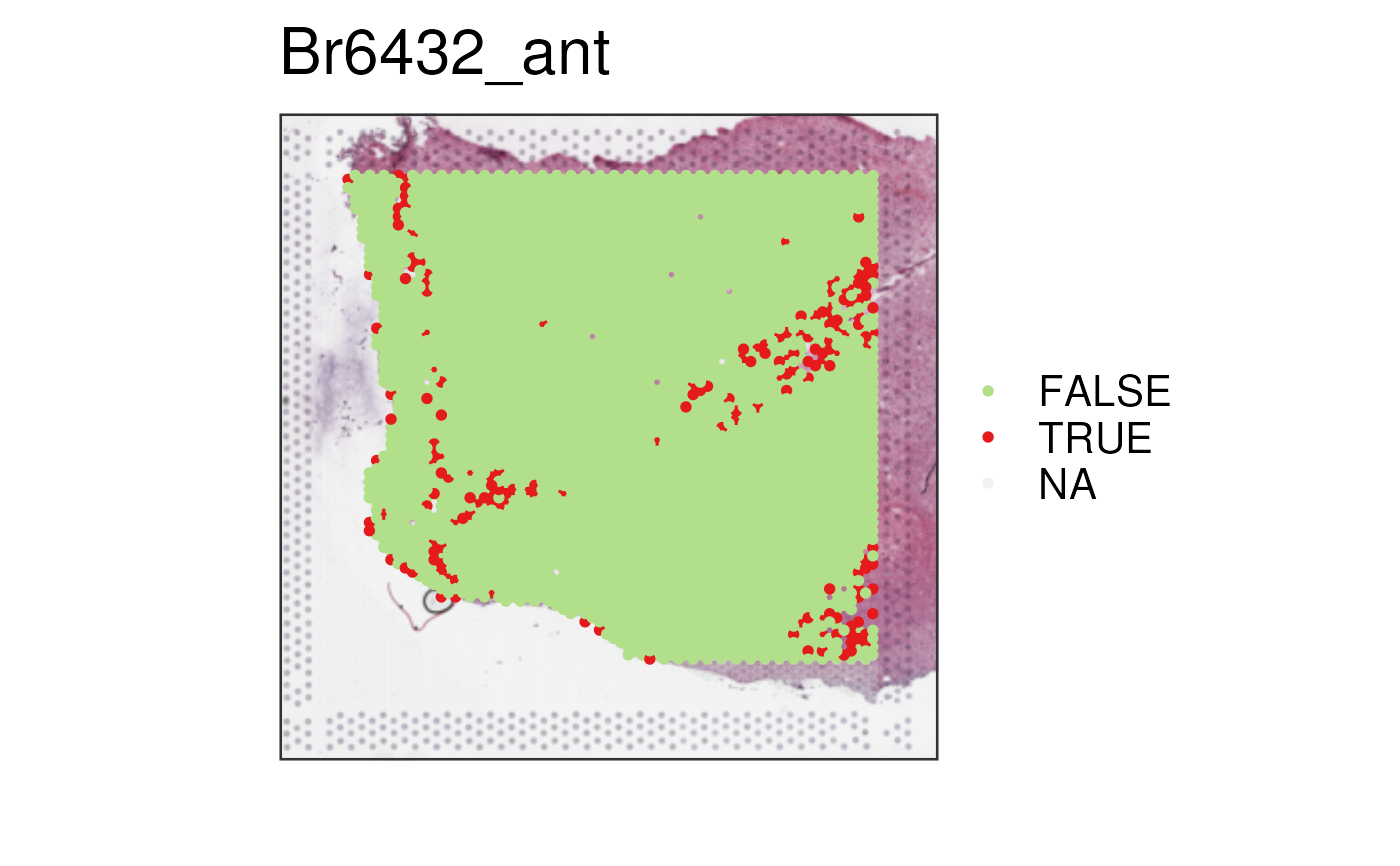
 ## Visualize scran QC flags
## Check the spots with low library size as detected by scran::isOutlier()
vis_clus(spe_qc, sample_id = "Br6432_ant", clustervar = "scran_low_lib_size")
## Visualize scran QC flags
## Check the spots with low library size as detected by scran::isOutlier()
vis_clus(spe_qc, sample_id = "Br6432_ant", clustervar = "scran_low_lib_size")
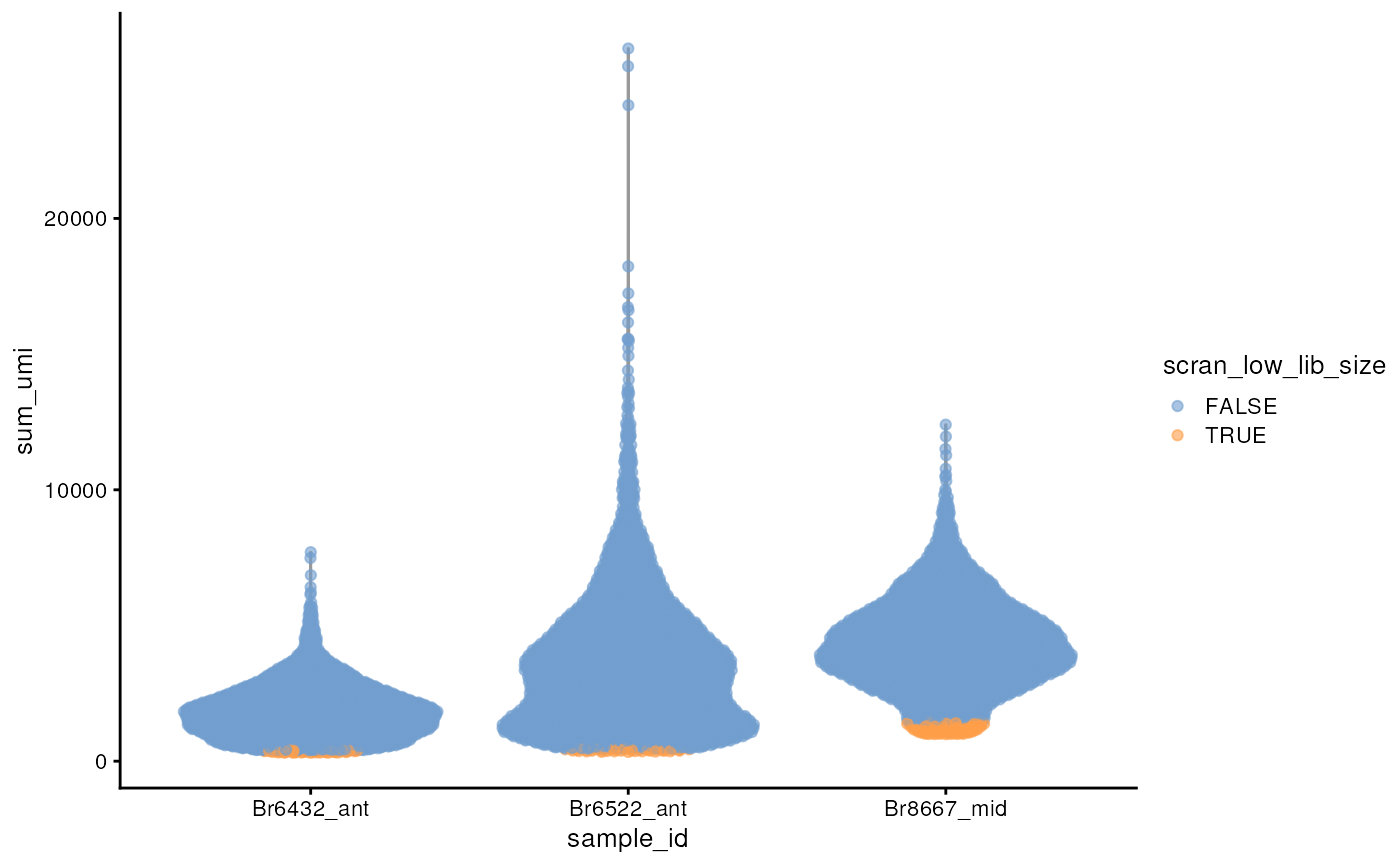
 ## Violin plot of library size with low library size highlighted in a
## different color.
scater::plotColData(spe_qc[, spe_qc$in_tissue], x = "sample_id", y = "sum_umi", colour_by = "scran_low_lib_size")
## Violin plot of library size with low library size highlighted in a
## different color.
scater::plotColData(spe_qc[, spe_qc$in_tissue], x = "sample_id", y = "sum_umi", colour_by = "scran_low_lib_size")
 ## Check any spots that scran::isOutlier() flagged
vis_clus(spe_qc, sampleid = "Br6432_ant", clustervar = "scran_discard")
## Check any spots that scran::isOutlier() flagged
vis_clus(spe_qc, sampleid = "Br6432_ant", clustervar = "scran_discard")
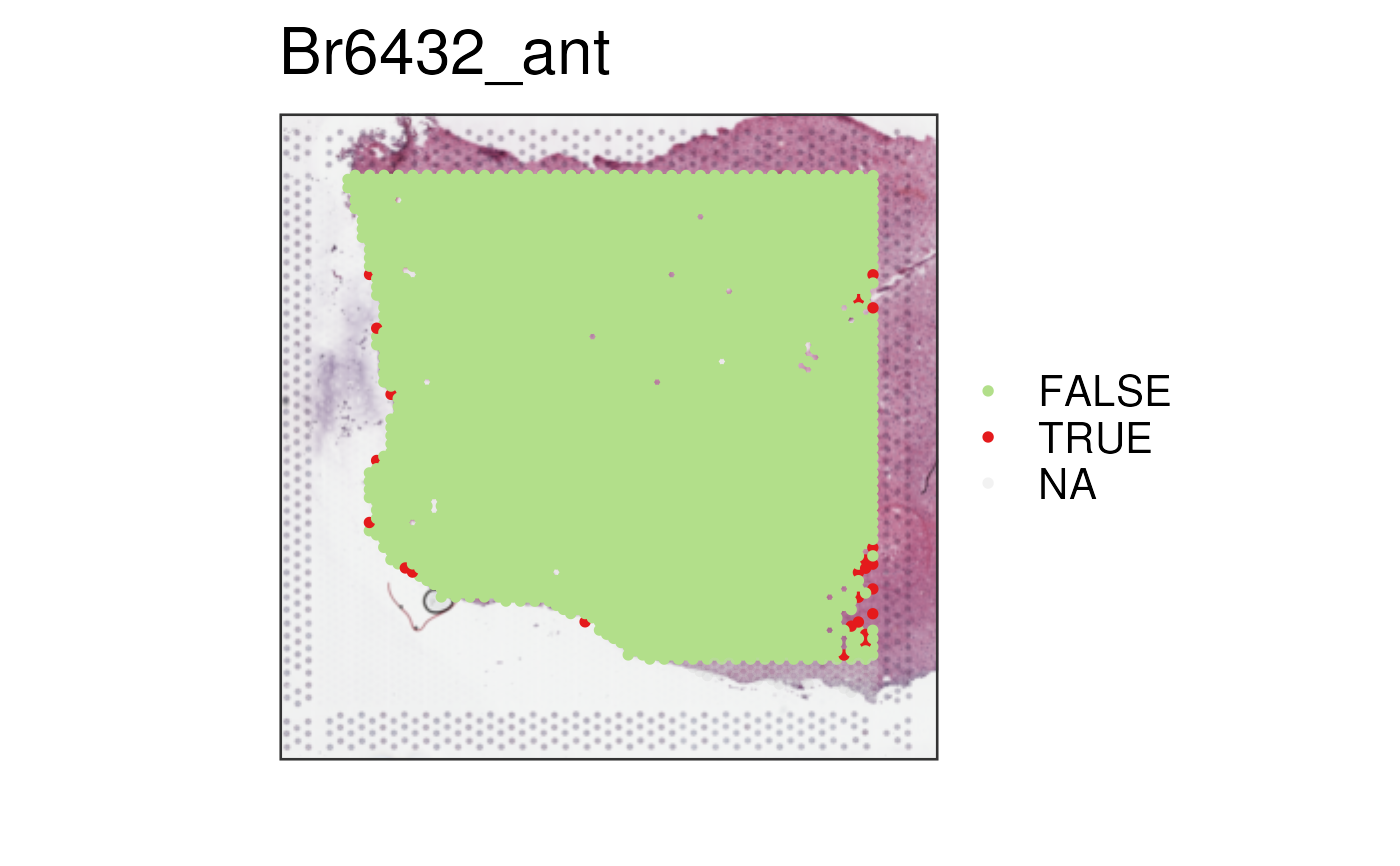
 ## Low library spots that are on the edge of the tissue
vis_clus(spe_qc, sampleid = "Br6432_ant", clustervar = "scran_low_lib_size_edge")
## Low library spots that are on the edge of the tissue
vis_clus(spe_qc, sampleid = "Br6432_ant", clustervar = "scran_low_lib_size_edge")
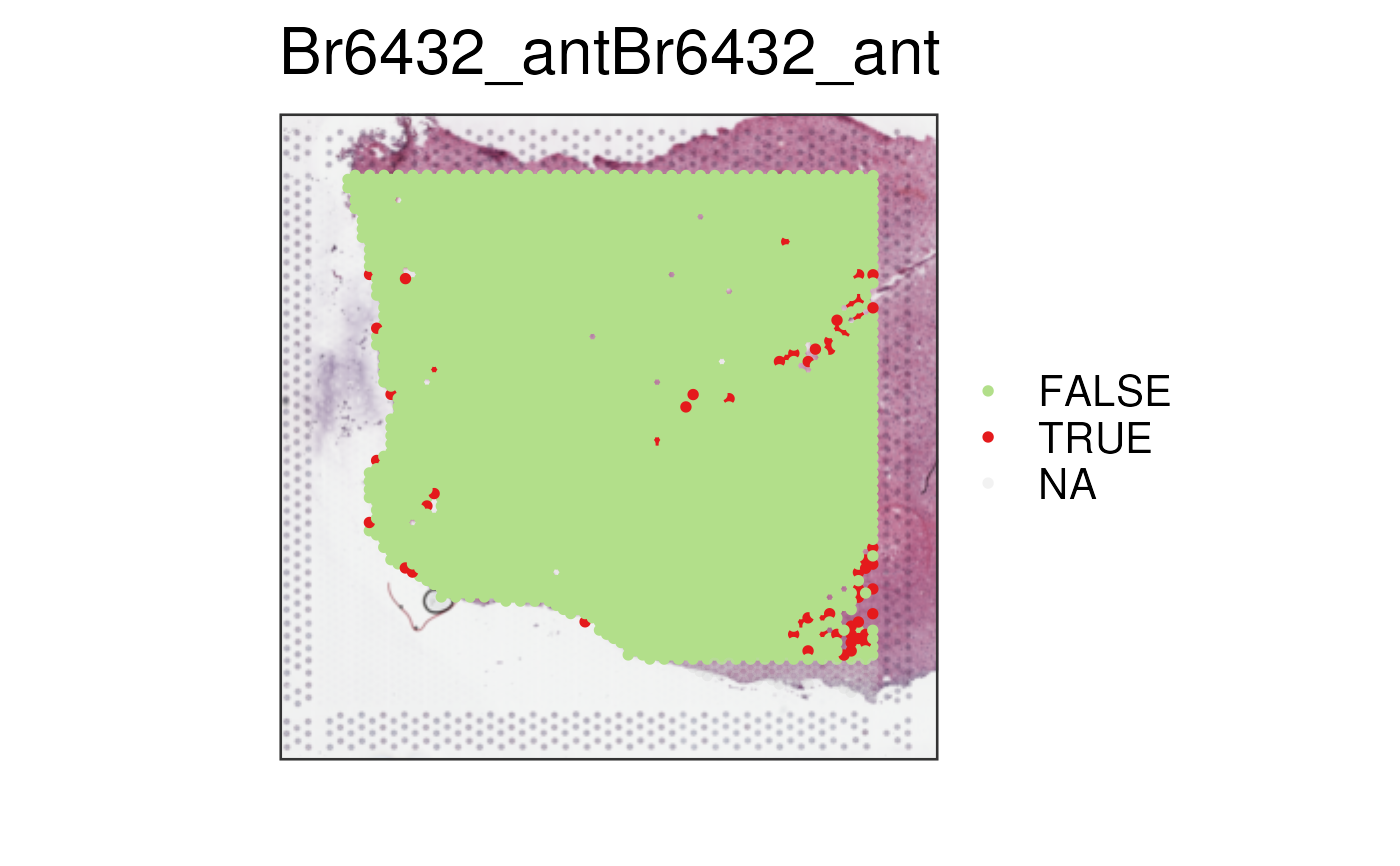
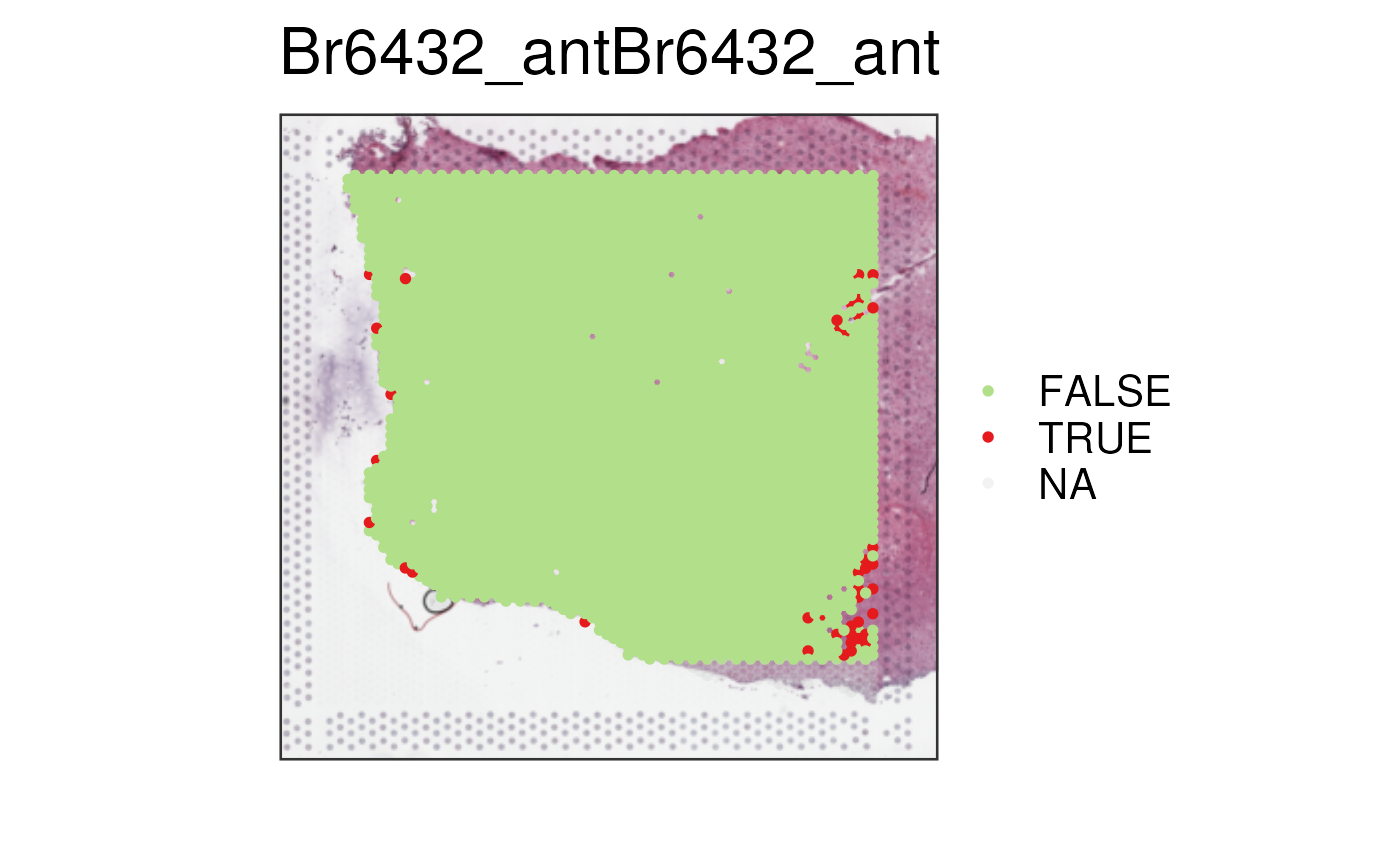
 ## Use `low_library_size` (or other variables) and `edge_distance` as you
## please.
spe_qc$our_low_lib_edge <- spe_qc$scran_low_lib_size & spe_qc$edge_distance < 5
vis_clus(spe_qc, sample_id = "Br6432_ant", clustervar = "our_low_lib_edge")
## Use `low_library_size` (or other variables) and `edge_distance` as you
## please.
spe_qc$our_low_lib_edge <- spe_qc$scran_low_lib_size & spe_qc$edge_distance < 5
vis_clus(spe_qc, sample_id = "Br6432_ant", clustervar = "our_low_lib_edge")
 ## Clean up
rm(spe_qc, spe_pre_qc, vars)
## Clean up
rm(spe_qc, spe_pre_qc, vars)