Create barplot of average cell type composition
Source:R/plot_composition_bar.R
plot_composition_bar.RdGiven a long formatted data.frame, this function creates a barplot for
the average cell type composition among a set of samples (donors) using
ggplot2.
plot_composition_bar(
  prop_long,
  sample_col = "RNum",
  x_col = "ALL",
  prop_col = "prop",
  ct_col = "cell_type",
  add_text = TRUE,
  min_prop_text = 0
)
Arguments
- prop_long
A
data.frameof cell type portions in long form- sample_col
A
character(1)specifying the name of column inprop_longthat identifies samples.- x_col
A
character(1)specifying the name of column inprop_longthat specifies the category to divide samples by.- prop_col
A
character(1)specifying the name of column inprop_longthat contains proportion values.- ct_col
A
character(1)specifying the name of column inprop_longcontaining cell type names.- add_text
A
logical(1)determining whether to add the rounded proportion value to the bars.- min_prop_text
A
numeric(1)specifying the minimum proportion to display text. Values greater than (>)min_prop_textwill be displayed.
Value
A stacked barplot ggplot2 object representing the mean proportion
of cell types for each group.
Examples
# Load example data
data("rse_bulk_test")
data("est_prop_test")
# extract relevant colData from the example RangedSummarizedExperiment object
pd <- SummarizedExperiment::colData(rse_bulk_test) |>
as.data.frame()
# combine with the example estimated proportions in a long style table
est_prop_test_long <- est_prop_test |>
tibble::rownames_to_column("RNum") |>
tidyr::pivot_longer(!RNum, names_to = "cell_type", values_to = "prop") |>
dplyr::inner_join(pd |> dplyr::select(RNum, Dx))
#> Joining with `by = join_by(RNum)`
est_prop_test_long
#> # A tibble: 500 × 4
#> RNum cell_type prop Dx
#> <chr> <chr> <dbl> <chr>
#> 1 R913 cell_A 0.431 Case
#> 2 R913 cell_B 0.242 Case
#> 3 R913 cell_C 0.110 Case
#> 4 R913 cell_D 0.174 Case
#> 5 R913 cell_E 0.0426 Case
#> 6 R602 cell_A 0.286 Control
#> 7 R602 cell_B 0.392 Control
#> 8 R602 cell_C 0.207 Control
#> 9 R602 cell_D 0.00186 Control
#> 10 R602 cell_E 0.113 Control
#> # ℹ 490 more rows
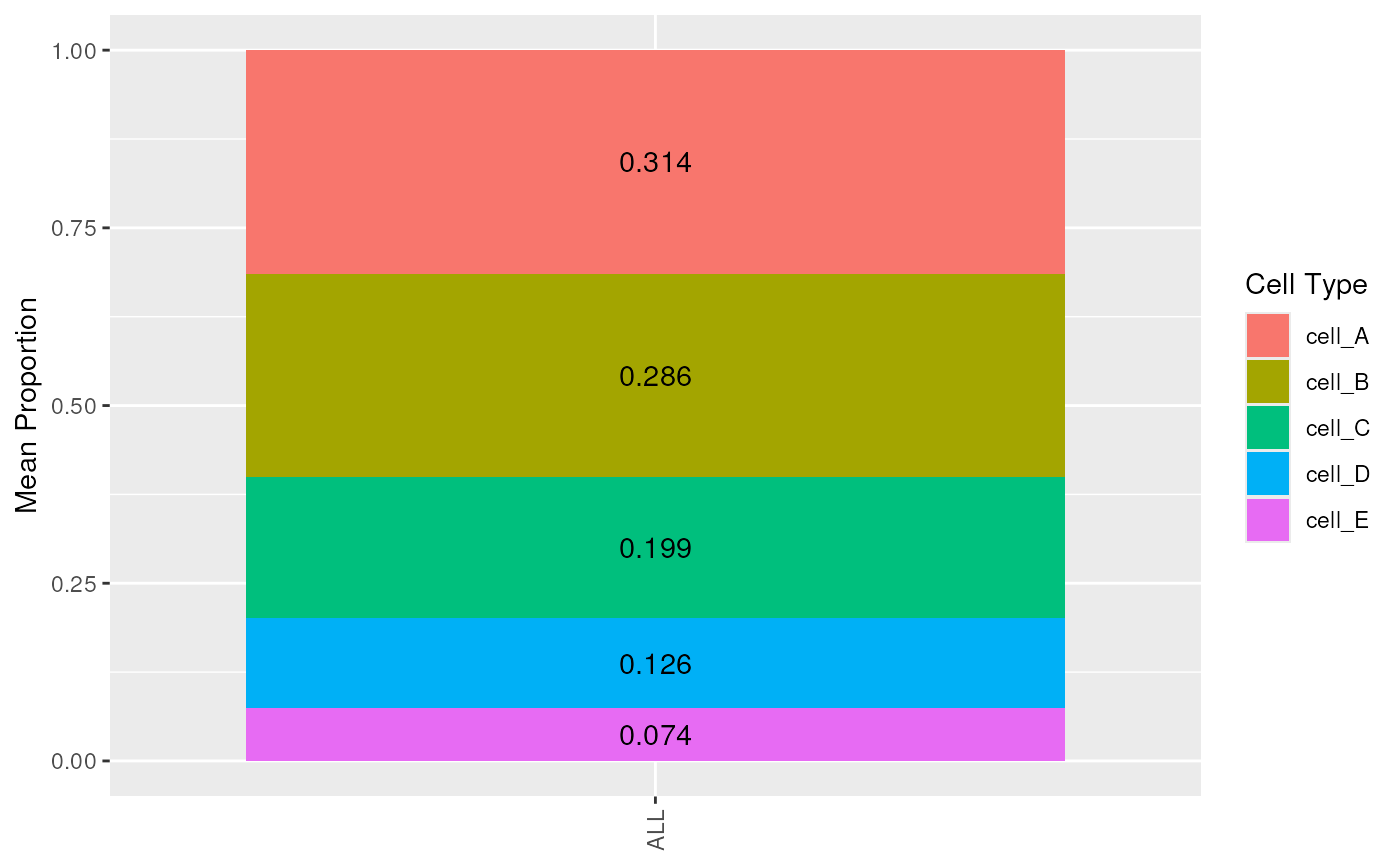
# Create composition bar plots
# Mean composition of all samples
plot_composition_bar(est_prop_test_long)
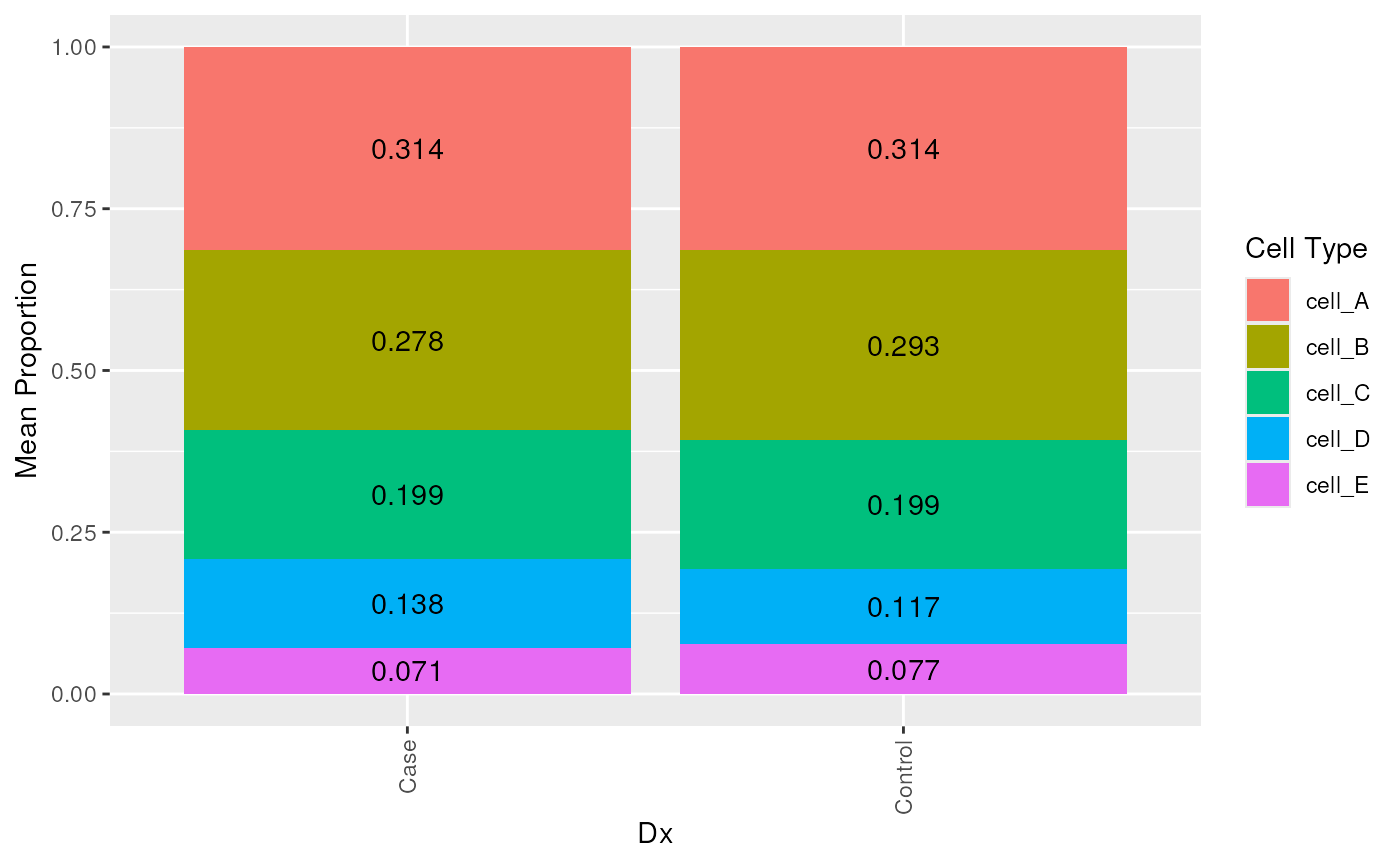
 # Mean composition by Dx
plot_composition_bar(est_prop_test_long, x_col = "Dx")
# Mean composition by Dx
plot_composition_bar(est_prop_test_long, x_col = "Dx")
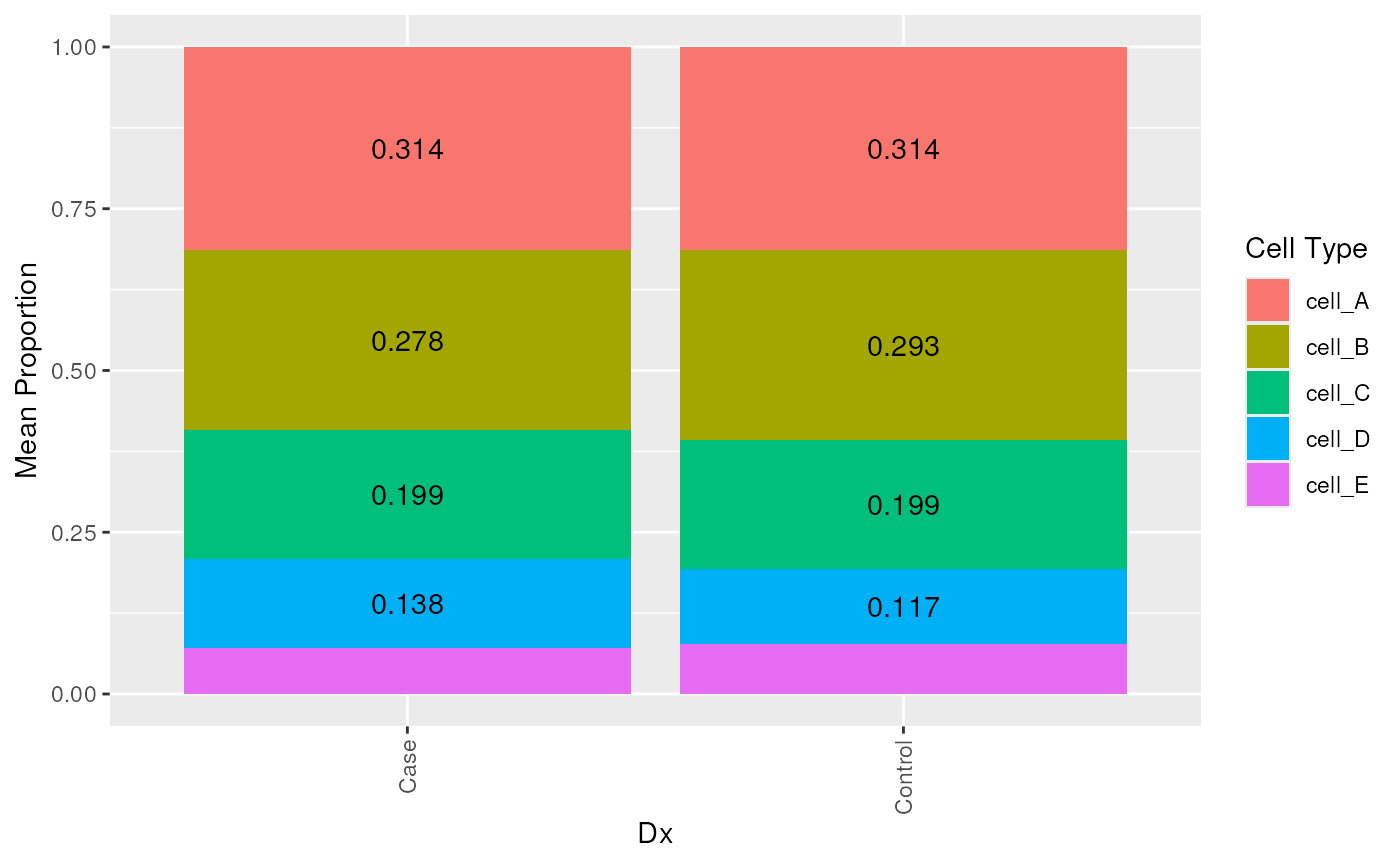
 # control minimum value of text to add
plot_composition_bar(est_prop_test_long, x_col = "Dx", min_prop_text = 0.1)
# control minimum value of text to add
plot_composition_bar(est_prop_test_long, x_col = "Dx", min_prop_text = 0.1)
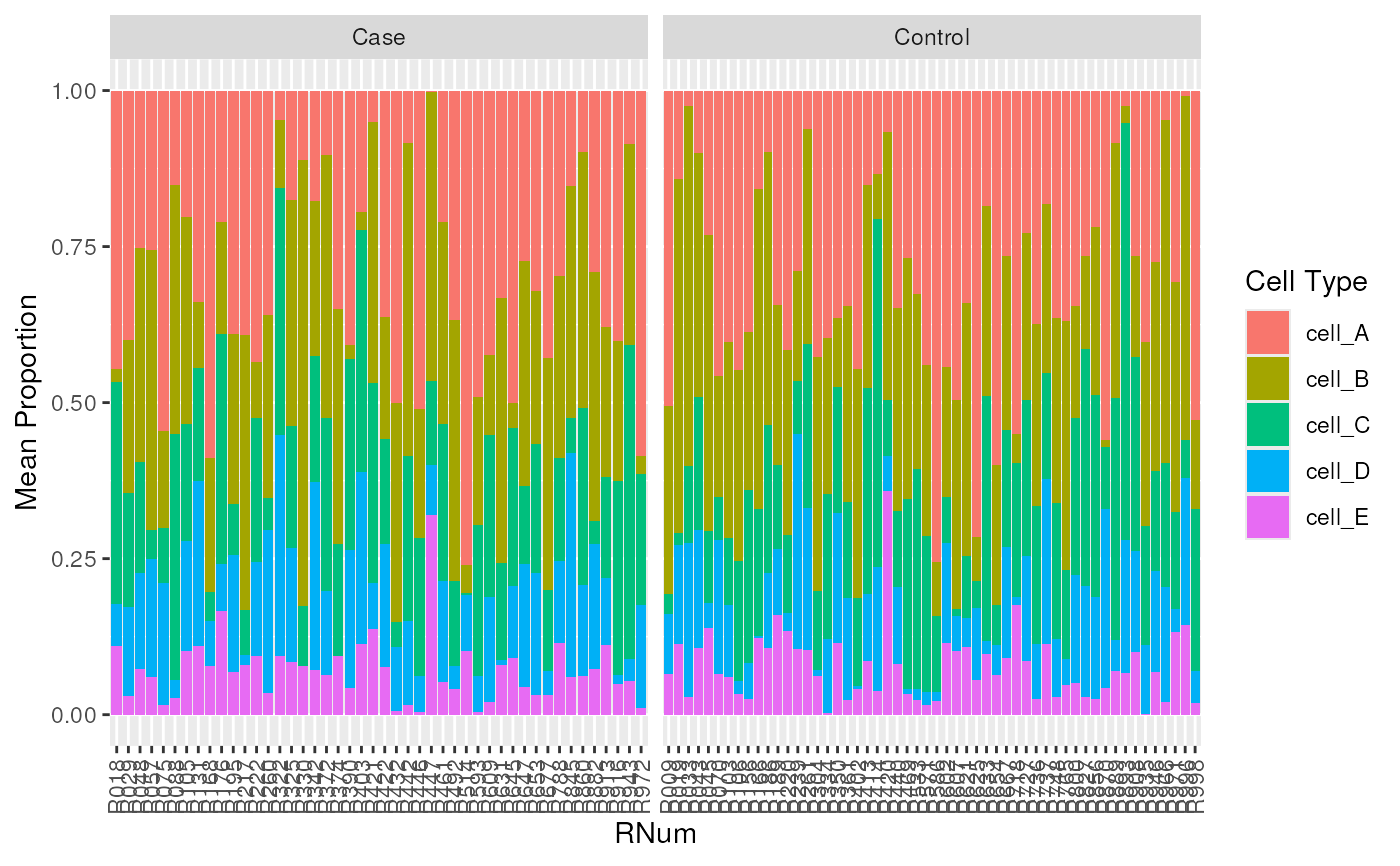
 # plot all samples, then facet by Dx
plot_composition_bar(est_prop_test_long, x_col = "RNum", add_text = FALSE) +
ggplot2::facet_wrap(~Dx, scales = "free_x")
# plot all samples, then facet by Dx
plot_composition_bar(est_prop_test_long, x_col = "RNum", add_text = FALSE) +
ggplot2::facet_wrap(~Dx, scales = "free_x")