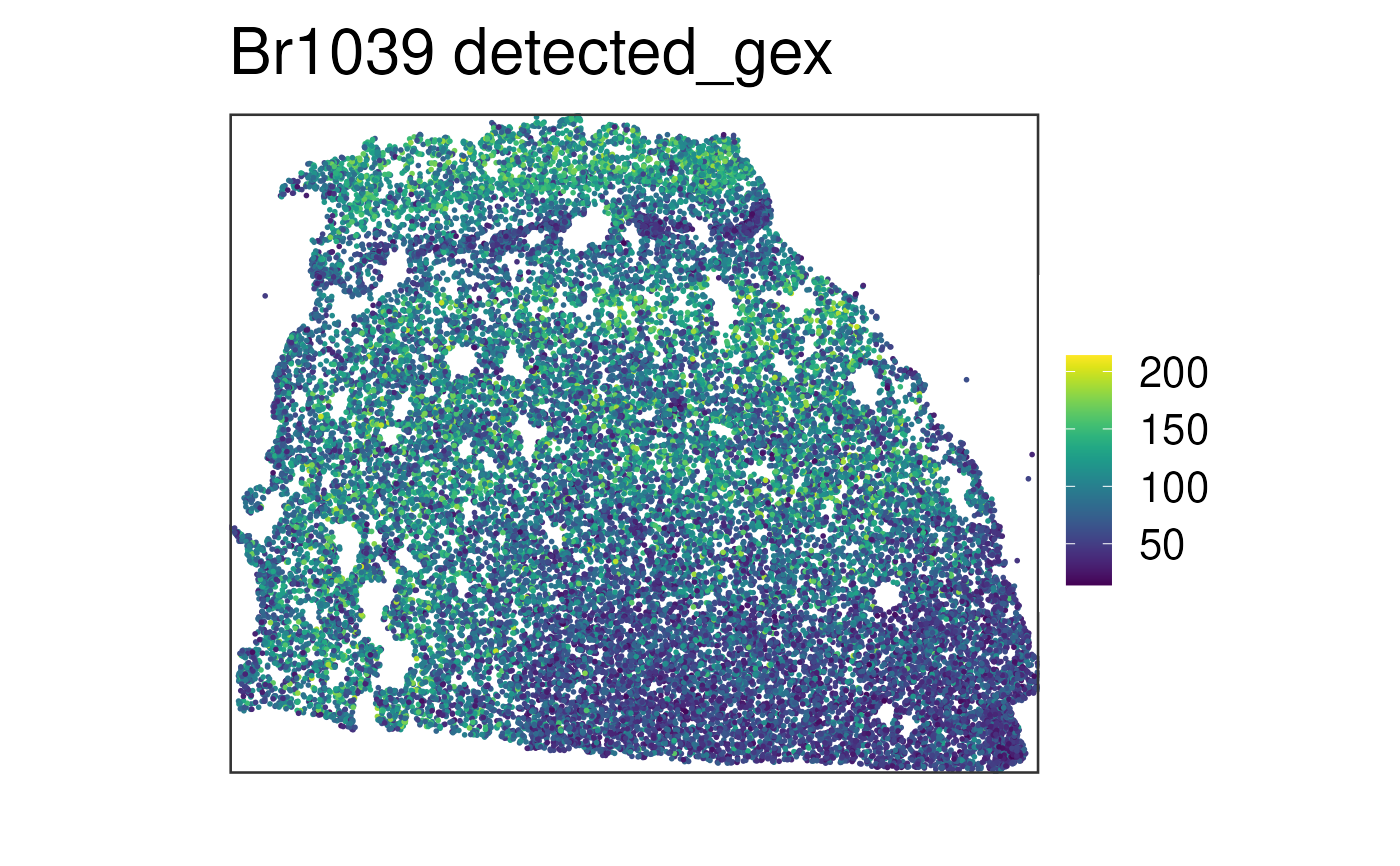
Sample spatial gene visualization workhorse function for Xenium data with centroid based spatailCoords
Source:R/vis_gene_c.R
vis_gene_c.RdThis function visualizes the gene expression stored in assays(spe) or any
continuous variable stored in colData(spe) for one given sample at the
spot-level using (by default) the histology information on the background.
This is the function that does all the plotting behind vis_clus() when
datatype = "Xenium". To visualize clusters (or any discrete variable)
use vis_clus_c().
Arguments
- spe
A SpatialExperiment-class object. See
fetch_data()for how to download some example objects orread10xVisiumWrapper()to read inspaceranger --countoutput files and build your ownspeobject.- d
A
data.frame()with the sample-level information. This is typically obtained usingcbind(colData(spe), spatialCoords(spe)). Thedata.framehas to contain a column with the continuous variable data to plot stored underd$COUNT.- sampleid
A
character(1)specifying which sample to plot fromcolData(spe)$sample_id(formerlycolData(spe)$sample_name).- title
The title for the plot.
- viridis
A
logical(1)whether to use the color-blind friendly palette from viridis or the color palette used in the paper that was chosen for contrast when visualizing the data on top of the histology image. One issue is being able to differentiate low values from NA ones due to the purple-ish histology information that is dependent on cell density.- alpha
A
numeric(1)in the[0, 1]range that specifies the transparency level of the data on the spots.- cont_colors
A
character()vector of colors that supersedes theviridisargument.- point_size
A
numeric(1)specifying the size of the points. Defaults to1.25. Some colors look better if you use2for instance.- na_color
A
character(1)specifying a color for the NA values. If you setalpha = NAthen it's best to setna_colorto a color that has alpha blending already, which will make non-NA values pop up more and the NA values will show with a lighter color. This behavior is lost whenalphais set to a non-NAvalue.- legend_title
A
character(1)specifying the legend title.
Value
A ggplot2 object.
See also
Other Spatial gene visualization functions:
vis_gene(),
vis_gene_p(),
vis_grid_gene()
Examples
if (enough_ram()) {
    ## Obtain the necessary data
    if (!exists("spe_xenium")) spe_xenium <- fetch_data("spe_xenium_example")

    ## Prepare the data for the plotting function
    spe_sub <- spe_xenium[, spe_xenium$sample_id == "Br1039"]
    df <- as.data.frame(cbind(colData(spe_sub), SpatialExperiment::spatialCoords(spe_sub)), optional = TRUE)
    df$COUNT <- df$detected_gex

    ## Don't plot the histology information
    p <- vis_gene_c(
        spe = spe_sub,
        d = df,
        sampleid = "Br1039",
        title = "Br1039 detected_gex",
        point_size = 1
    )
    print(p)

    ## Clean up
    rm(spe_sub)
}
#> 2026-09-28 14:56:08.009874 loading file /github/home/.cache/R/BiocFileCache/e2d6c76d1f9_spe_Xenium_test.rds%3Frlkey%3D0ql1pu5d9qe448sjmkh3ja3o8%26st%3Dnpwqxtdk%26dl%3D1