Plot gene expression violin plots for top marker genes for one cell type
Source:R/plot_marker_express.R
plot_marker_express.RdThis function plots the top n marker genes for a specified cell type based off of
the stats table from get_mean_ratio().
The gene expression is plotted as violin plot with plot_gene_express and adds
annotations to each plot.
plot_marker_express(
  sce,
  stats,
  cell_type,
  n_genes = 4,
  rank_col = "MeanRatio.rank",
  anno_col = "MeanRatio.anno",
  gene_col = "gene",
  cellType_col = "cellType",
  color_pal = NULL,
  plot_points = FALSE,
  ncol = 2
)
Arguments
- sce
SummarizedExperiment-class object
- stats
A
data.frame()generated byget_mean_ratio()and/orfindMarkers_1vAll().- cell_type
A
character()target cell type to plot markers for- n_genes
An
integer(1)of number of markers you'd like to plot- rank_col
The
character(1)name of column to rank genes by instats.- anno_col
The
character(1)name of column containing annotation instats.- gene_col
The
character(1)name of column containing gene name instatsshould be the same syntax asrownames(sce).- cellType_col
The
character(1)name ofcolData()column containing cell type forscedata. It should matchcellType.targetinstats.- color_pal
A named
character(1)vector that contains a color palette matching thecell_typevalues.- plot_points
A
logical(1)indicating whether to plot points over the violin, defaults toFALSEas these often become over plotted and quite large (especially when saved as PDF).- ncol
An
integer(1)specifying the number of columns for the facet in the final plot. Defaults to 2.
Value
A ggplot2 object created with plot_gene_express(). It is
a scater::plotExpression() style violin plot for selected marker genes.
See also
Other expression plotting functions:
plot_gene_express(),
plot_marker_express_ALL(),
plot_marker_express_List()
Examples
## Download the processed study data from
## <https://github.com/LieberInstitute/Human_DLPFC_Deconvolution>.
if (!exists("sce_DLPFC_example")) sce_DLPFC_example <- fetch_deconvo_data("sce_DLPFC_example")
#> 2026-03-31 18:33:39.86392 Access ExperimentHub EH9626
#> see ?DeconvoBuddies and browseVignettes('DeconvoBuddies') for documentation
#> loading from cache
## load example marker stats
data("marker_test")
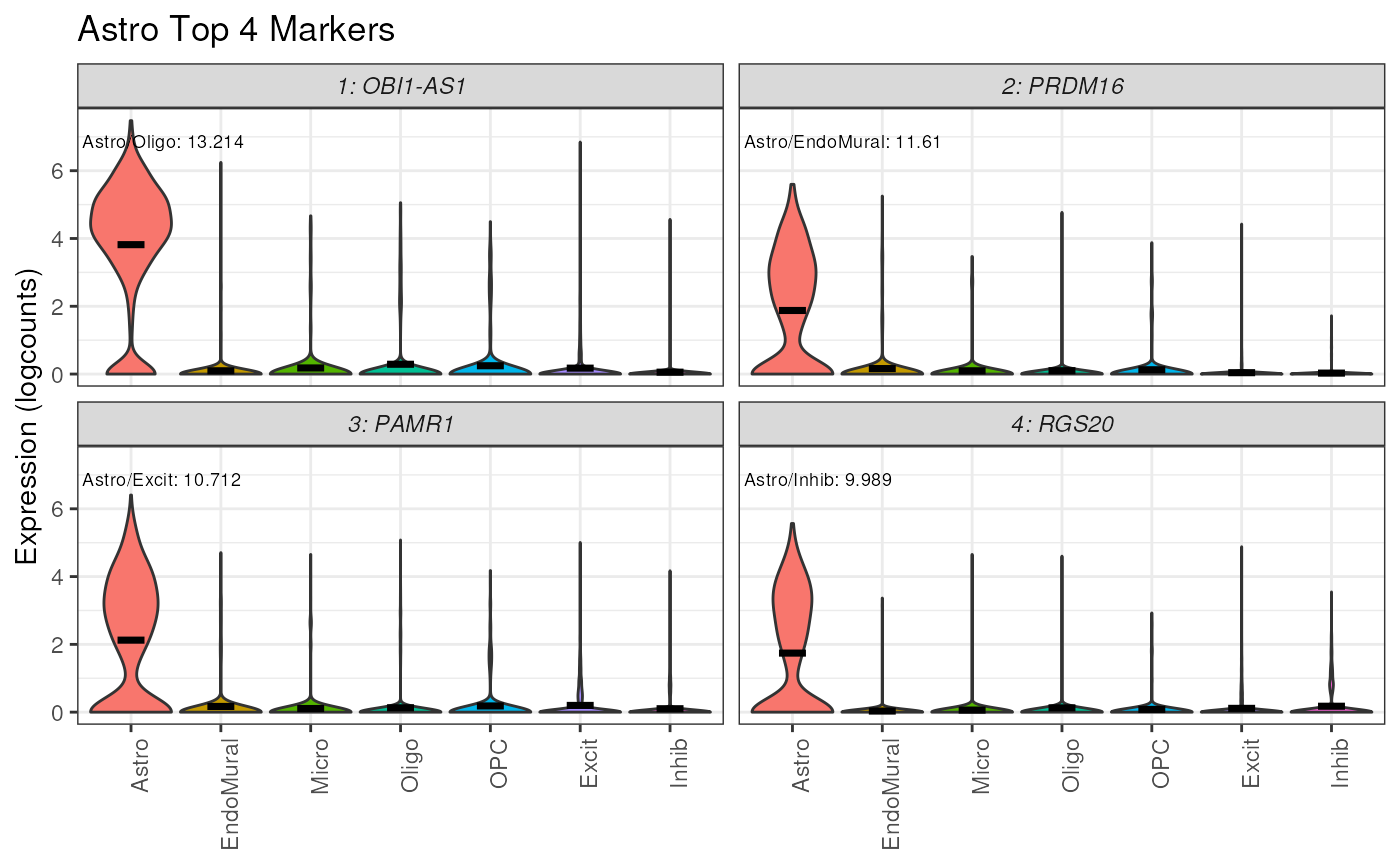
## Plot the top markers for Astrocytes
plot_marker_express(
sce = sce_DLPFC_example,
stat = marker_test,
cellType_col = "cellType_broad_hc",
cell_type = "Astro",
gene_col = "gene"
)