Plot the gene expression of a list of genes in a SCE object
Source:R/plot_gene_express.R
plot_gene_express.RdThis function plots the expression of one or more genes as a violin plot,
over a user defined category, typically a cell type annotation. The plots are
made using ggplot2.
plot_gene_express(
  sce,
  genes,
  assay_name = "logcounts",
  category = "cellType",
  color_pal = NULL,
  title = NULL,
  plot_points = FALSE,
  ncol = 2,
  plot_type = c("violin", "boxplot"),
  free_y = FALSE
)
Arguments
- sce
A SummarizedExperiment-class object or one inheriting it.
- genes
A
character()vector specifying the genes to plot, this should match the format ofrownames(sce).- assay_name
A
character(1)specifying the name of the assay() in thesceobject to use to rank expression values. Defaults tologcountssince it typically contains the normalized expression values.- category
A
character(1)specifying the name of the categorical variable to group the cells or nuclei by. Defaults tocellType.- color_pal
A named
character(1)vector that contains a color palette matching thecategoryvalues.- title
A
character(1)to title the plot.- plot_points
A
logical(1)indicating whether to plot points over the violin, defaults toFALSEas these often become over plotted and quite large (especially when saved as PDF).- ncol
An
integer(1)specifying the number of columns for the facet in the final plot. Defaults to 2.- plot_type
A
character(1)specifying whether to plot a 'violin' (default) or 'boxplot'.- free_y
logical(1)indicating whether to use "free" y-axis between genes (relevant tofacet_wrap).
Value
A ggplot() violin plot for selected genes.
See also
Other expression plotting functions:
plot_marker_express(),
plot_marker_express_ALL(),
plot_marker_express_List()
Examples
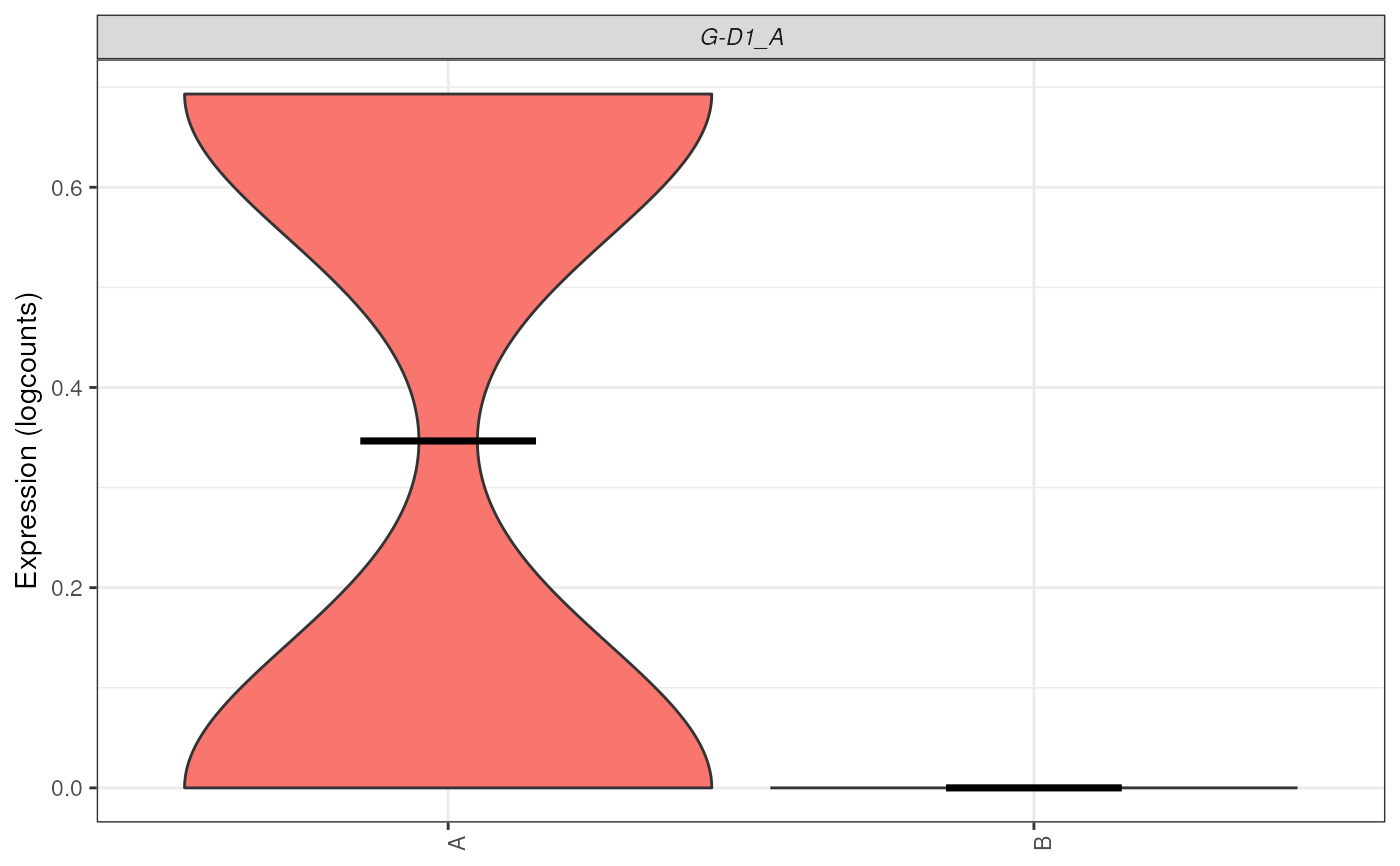
## Using Symbol as rownames makes this more human readable
data("sce_ab")
plot_gene_express(sce = sce_ab, genes = c("G-D1_A"))
 plot_gene_express(sce = sce_ab, genes = c("G-D1_A"), plot_type = "boxplot")
 # Access example data
if (!exists("sce_DLPFC_example")) sce_DLPFC_example <- fetch_deconvo_data("sce_DLPFC_example")
#> 2026-03-31 18:33:32.982392 Access ExperimentHub EH9626
#> see ?DeconvoBuddies and browseVignettes('DeconvoBuddies') for documentation
#> loading from cache
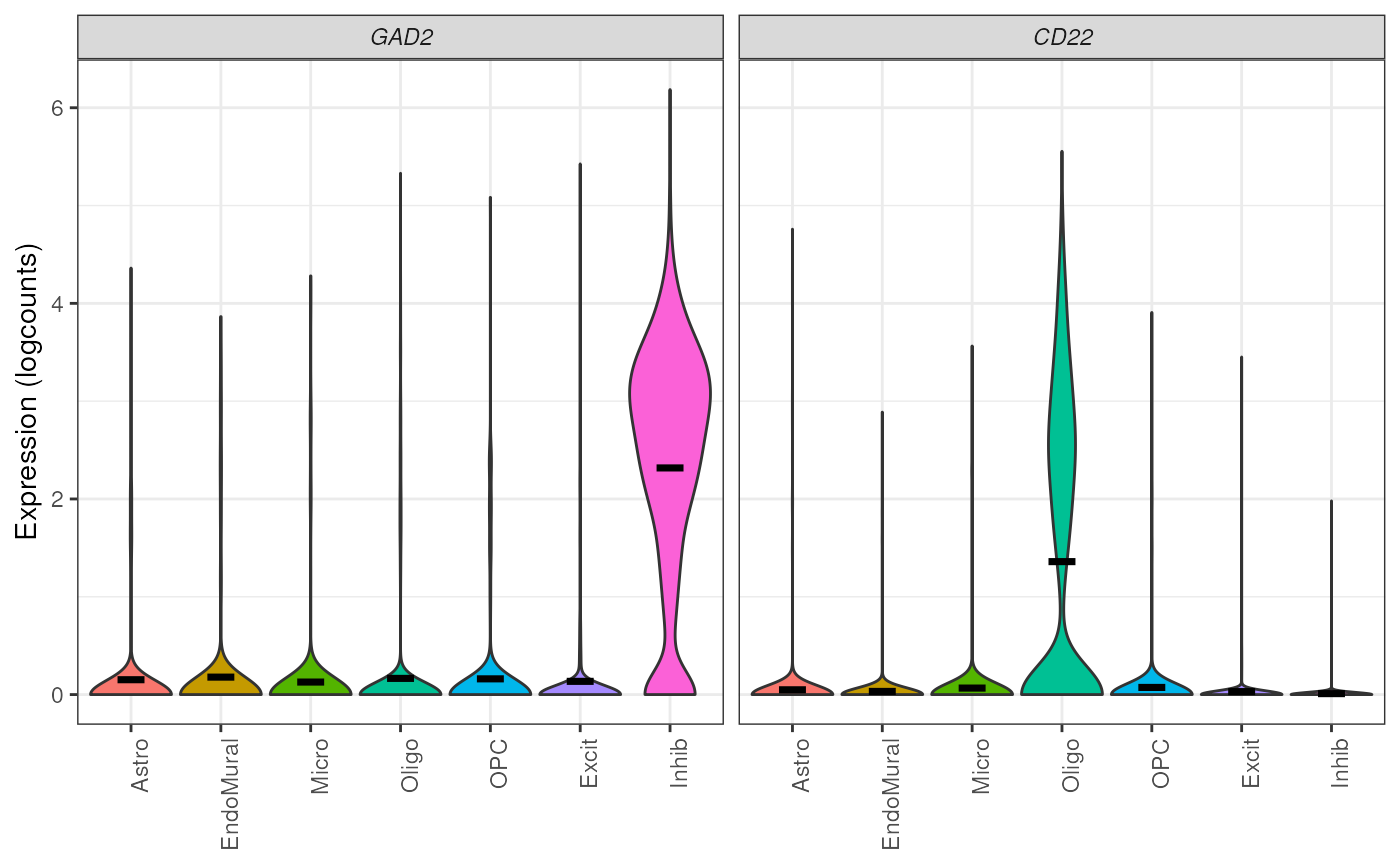
## plot expression of two genes
plot_gene_express(
sce = sce_DLPFC_example,
category = "cellType_broad_hc",
genes = c("GAD2", "CD22")
)
# Access example data
if (!exists("sce_DLPFC_example")) sce_DLPFC_example <- fetch_deconvo_data("sce_DLPFC_example")
#> 2026-03-31 18:33:32.982392 Access ExperimentHub EH9626
#> see ?DeconvoBuddies and browseVignettes('DeconvoBuddies') for documentation
#> loading from cache
## plot expression of two genes
plot_gene_express(
sce = sce_DLPFC_example,
category = "cellType_broad_hc",
genes = c("GAD2", "CD22")
)
 ## plot as boxplot
plot_gene_express(
sce = sce_DLPFC_example,
category = "cellType_broad_hc",
genes = c("GAD2", "CD22"),
plot_type = "boxplot"
)
## plot as boxplot
plot_gene_express(
sce = sce_DLPFC_example,
category = "cellType_broad_hc",
genes = c("GAD2", "CD22"),
plot_type = "boxplot"
)
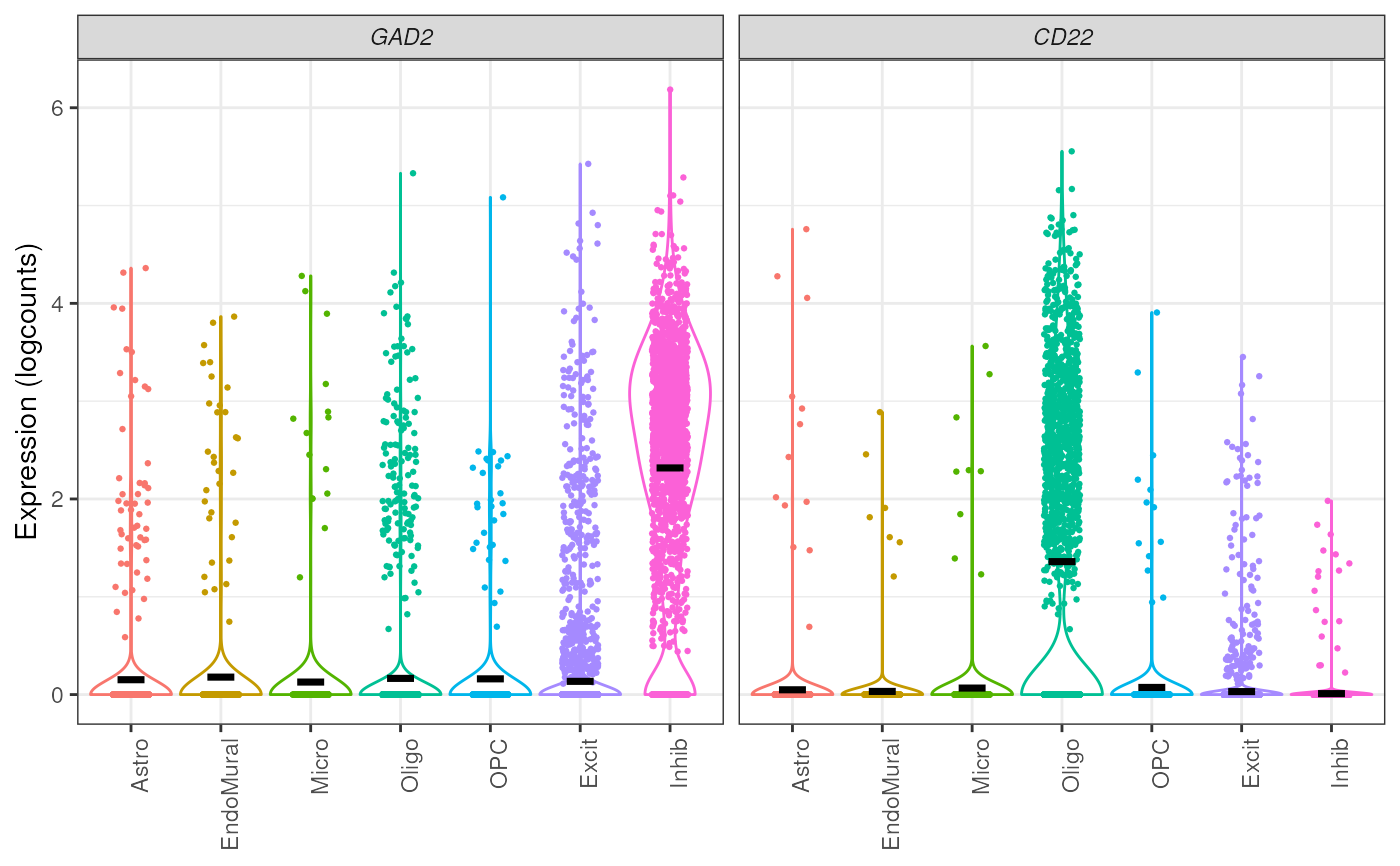
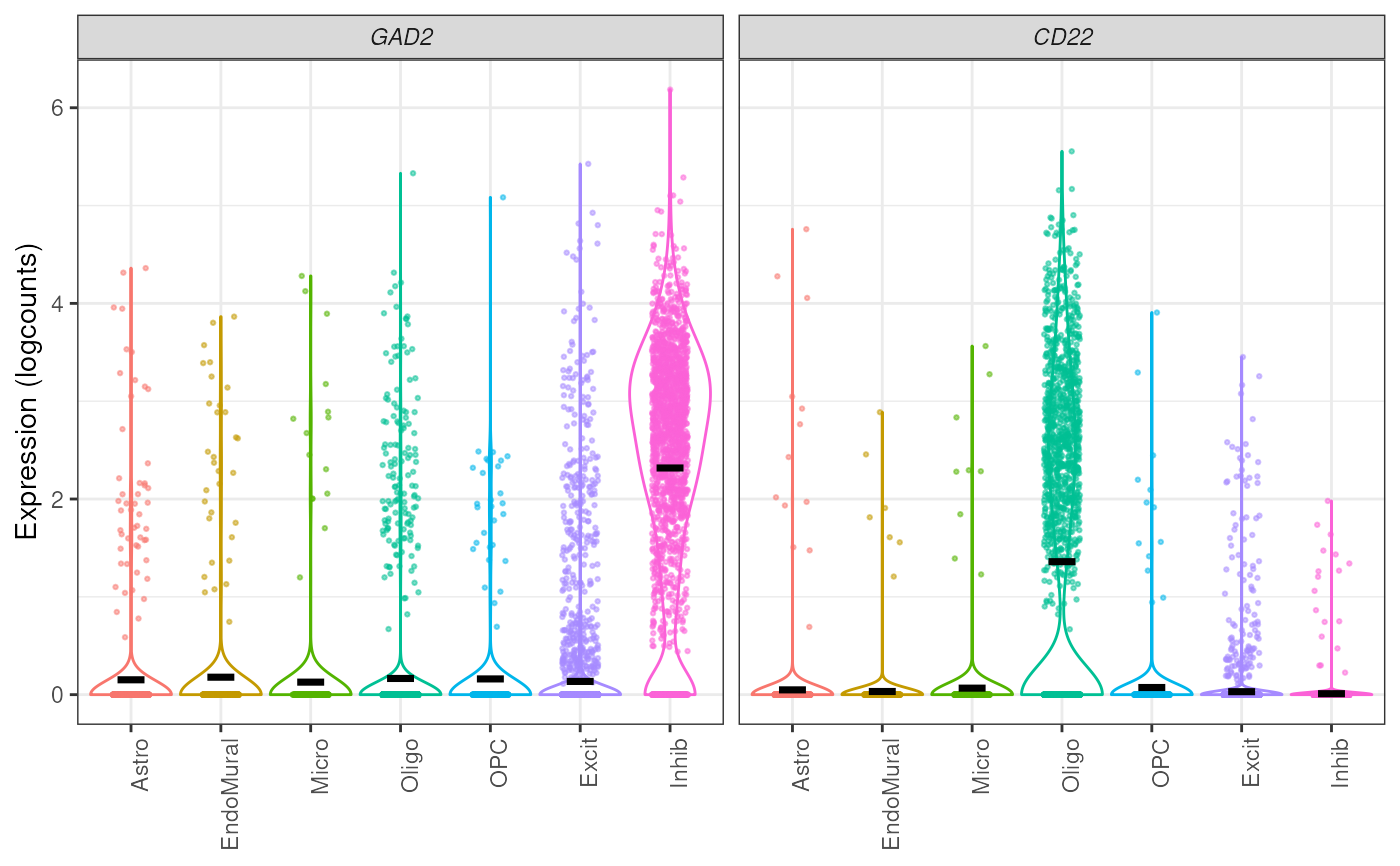
 ## plot points - note this creates large images and is easy to over plot
plot_gene_express(
sce = sce_DLPFC_example,
category = "cellType_broad_hc",
genes = c("GAD2", "CD22"),
plot_points = TRUE
)
## plot points - note this creates large images and is easy to over plot
plot_gene_express(
sce = sce_DLPFC_example,
category = "cellType_broad_hc",
genes = c("GAD2", "CD22"),
plot_points = TRUE
)
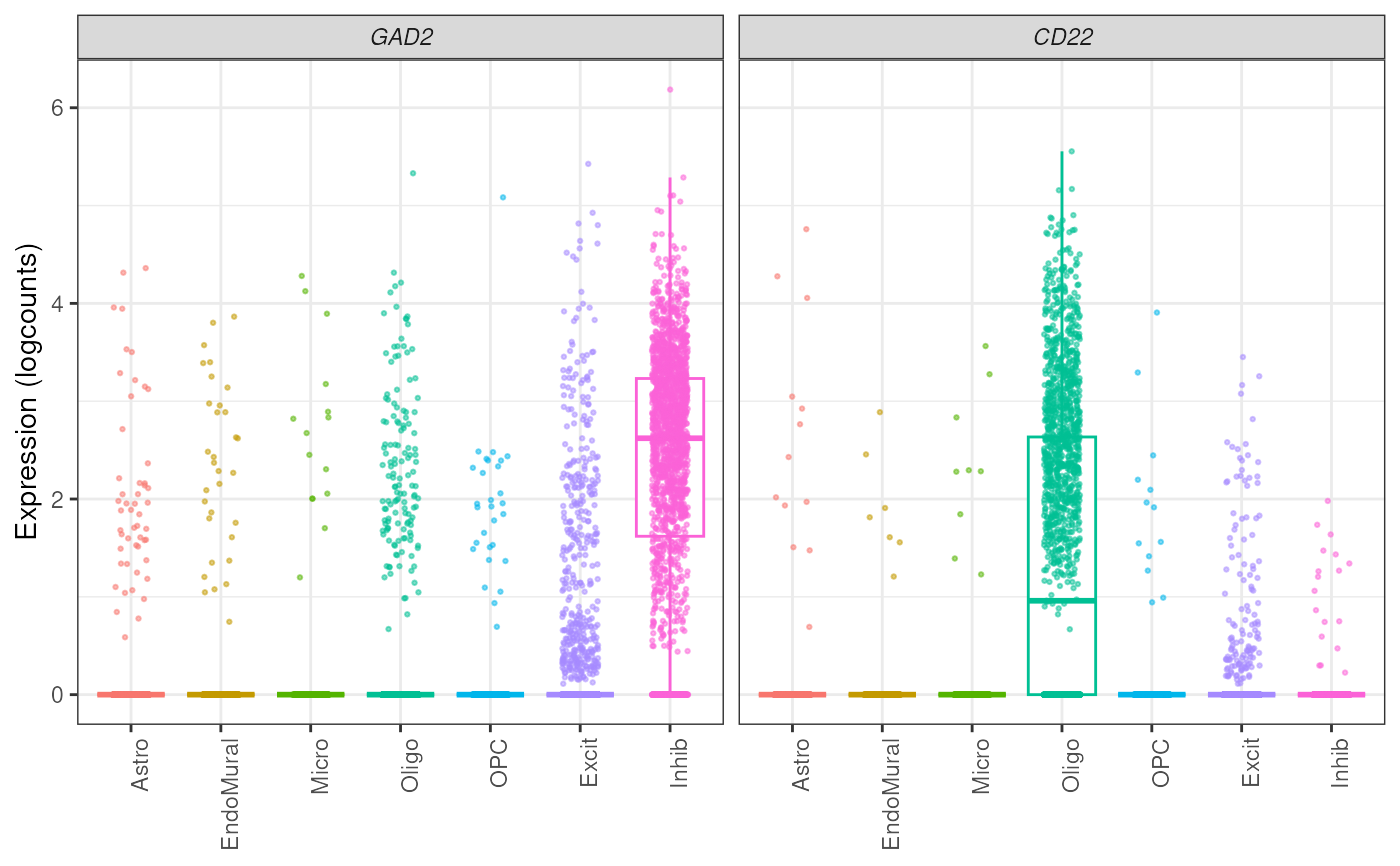
 ## with boxplot
plot_gene_express(
sce = sce_DLPFC_example,
category = "cellType_broad_hc",
genes = c("GAD2", "CD22"),
plot_points = TRUE,
plot_type = "boxplot"
)
## with boxplot
plot_gene_express(
sce = sce_DLPFC_example,
category = "cellType_broad_hc",
genes = c("GAD2", "CD22"),
plot_points = TRUE,
plot_type = "boxplot"
)
 ## Use free y-axis between genes
plot_gene_express(
sce = sce_DLPFC_example,
category = "cellType_broad_hc",
genes = c("GAD2", "CD22"),
plot_points = TRUE,
plot_type = "boxplot",
free_y = FALSE
)
## Use free y-axis between genes
plot_gene_express(
sce = sce_DLPFC_example,
category = "cellType_broad_hc",
genes = c("GAD2", "CD22"),
plot_points = TRUE,
plot_type = "boxplot",
free_y = FALSE
)
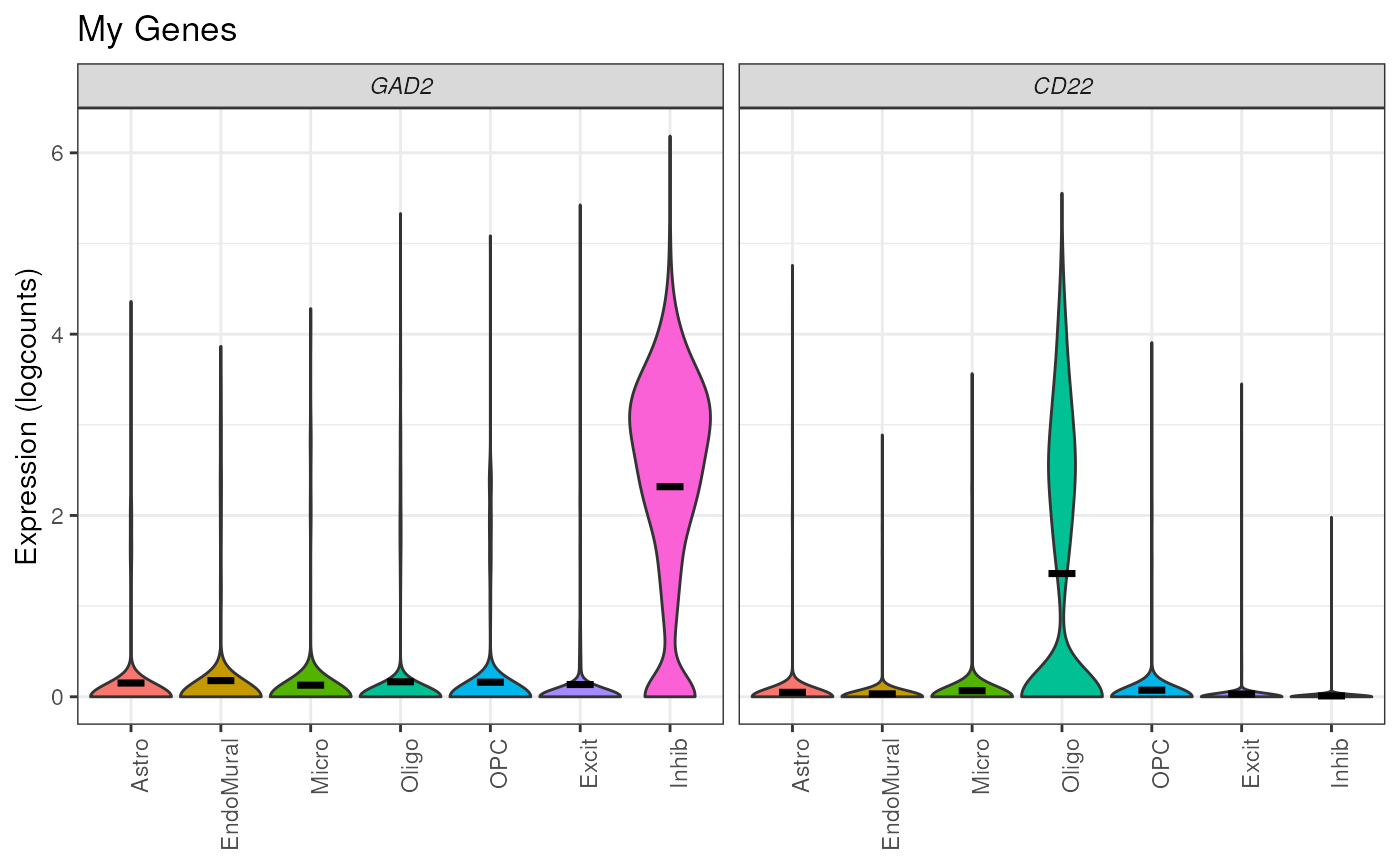
 ## Add title
plot_gene_express(
sce = sce_DLPFC_example,
category = "cellType_broad_hc",
genes = c("GAD2", "CD22"),
title = "My Genes"
)
## Add title
plot_gene_express(
sce = sce_DLPFC_example,
category = "cellType_broad_hc",
genes = c("GAD2", "CD22"),
title = "My Genes"
)
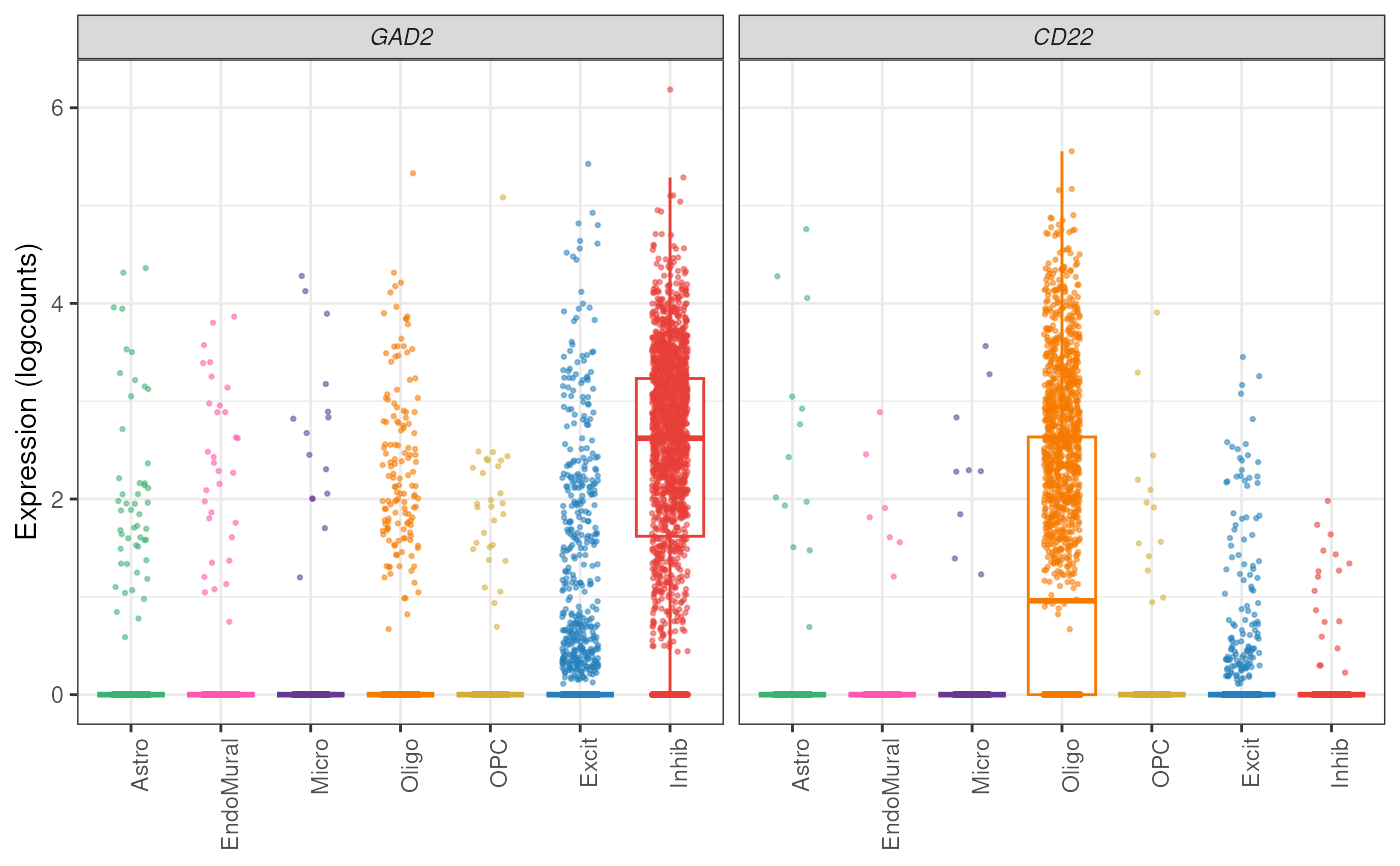 ## Add color pallet
my_cell_colors <- create_cell_colors(cell_types = levels(sce_DLPFC_example$cellType_broad_hc))
#> Creating classic palette for 7 broad cell types
plot_gene_express(
sce = sce_DLPFC_example,
category = "cellType_broad_hc",
genes = c("GAD2", "CD22"),
color_pal = my_cell_colors,
plot_type = "boxplot",
plot_points = TRUE
)
## Add color pallet
my_cell_colors <- create_cell_colors(cell_types = levels(sce_DLPFC_example$cellType_broad_hc))
#> Creating classic palette for 7 broad cell types
plot_gene_express(
sce = sce_DLPFC_example,
category = "cellType_broad_hc",
genes = c("GAD2", "CD22"),
color_pal = my_cell_colors,
plot_type = "boxplot",
plot_points = TRUE
)
